Figure S5.
Pharmacological Inhibition of Host Factors in Huh7.5.1 and Calu-3 cells, and Validation of On-Target Activity of SREBP Pathway Inhibitors, Related to Figure 4
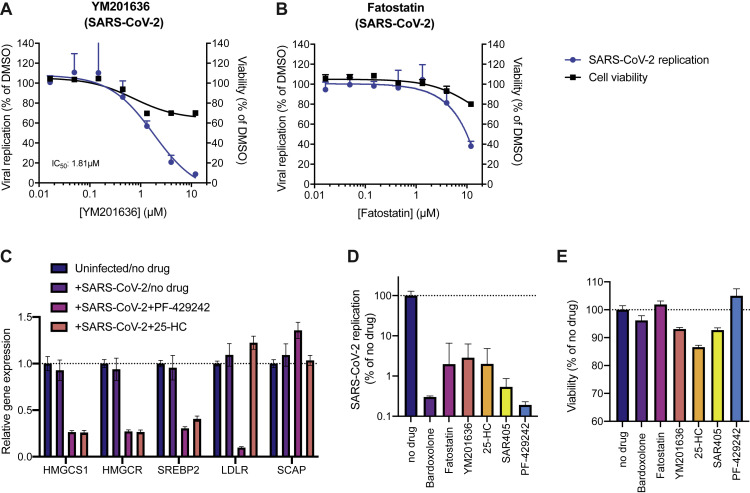
(A and B) Dose-response curves of the effect of (A) YM201636 and (B) Fatostatin on SARS-CoV-2 replication in Huh7.5.1 cells and on cell viability of drug treated cells. Viral RNA was quantified after 24 hpi using RT-qPCR and normalized to RnaseP. Values represent means ± SEM relative to DMSO treated cells. Non-linear curves were fitted with least-squares regression using GraphPad Prism 8 and IC50 was determined. All experiments were performed with 3 biological replicates.
(C) Gene expression analysis of the SREBP-regulated cholesterol biosynthesis genes 3-Hydroxy-3-Methylglutaryl-CoA Synthase 1 (HMGCS1) and HMG-CoA reductase (HMGCR) as well as SREBP2, LDLR and SCAP in uninfected/no drug, infected/no drug and infected/drug-treated conditions (25 μM PF-429242 and 6.25 μM 25-HC) in Huh7.5.1 cells at 24 h post-infection/treatment. mRNA levels are displayed as means ± SEM from three biological replicates and are relative to expression in uninfected/no drug cells.
(D) RT-qPCR quantification of intracellular SARS-CoV-2 levels in drug-treated Calu-3 cells. Cells were infected using moi = 0.1, treated with 5 μM at time of infection and harvested at 24 hpi. Values represent means ± SEM from three biological replicates and are relative to the no drug (DMSO treated) condition.
(E) Cell viability of drug-treated Calu-3 cells 24 h after addition of compounds using Cell Titer Glo. Values are displayed as means ± SD from three biological replicates.

