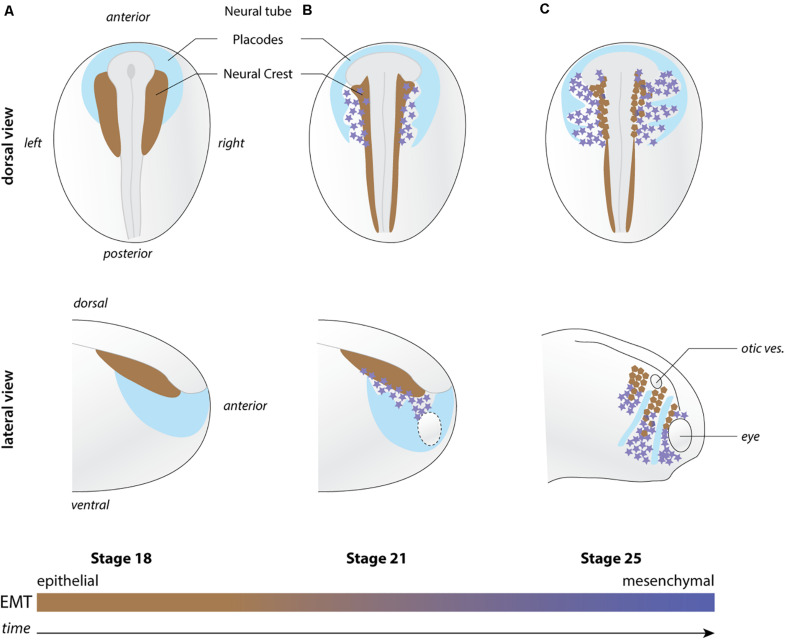
FIGURE 1.
Overview of neural crest migration. (A–C) Diagrams depicting the position of NC cells (shades of brown to magenta) with respect to the placodal region (light blue) at pre-migration (stage 18), early migration (stage 21), and late migration (stage 25). EMT is progressively implemented as NC migration proceeds. Brown NC cells are more epithelial while magenta star-shaped NC cells are more mesenchymal. Top and bottom rows shows lateral views and dorsal views, respectively. Orientations and structures are indicated on the figure. Ot. ves., otic vesicle.

