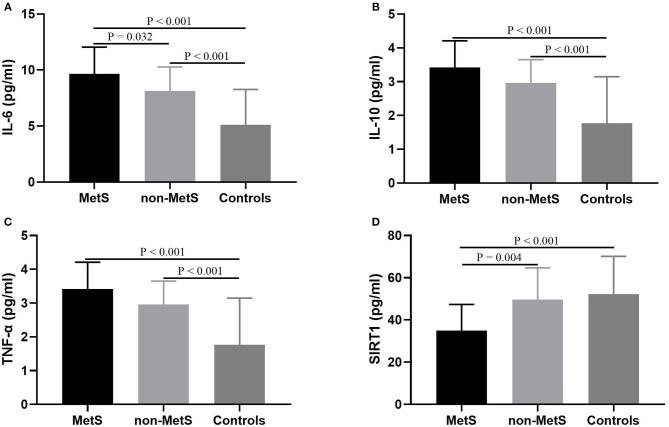
Figure 1.
Comparisons of SIRT1 and cytokines levels among MetS patients, non-MetS patients, and control subjects. Each bar represents the mean level of SIRT1 or cytokines. Error bars represent the standard deviation (SD). P-value was calculated by adjusting for the characteristics including age, sex, and body mass index. (A) Comparison of IL-6 levels among three groups; (B) Comparison of IL-10 levels among three groups; (C) Comparison of TNF-α levels among three groups; (D) Comparison of SIRT1 levels among three groups. MetS, metabolic syndrome; SIRT1, sirtuins; IL, interleukin; TNF, tumor necrosis factor.

