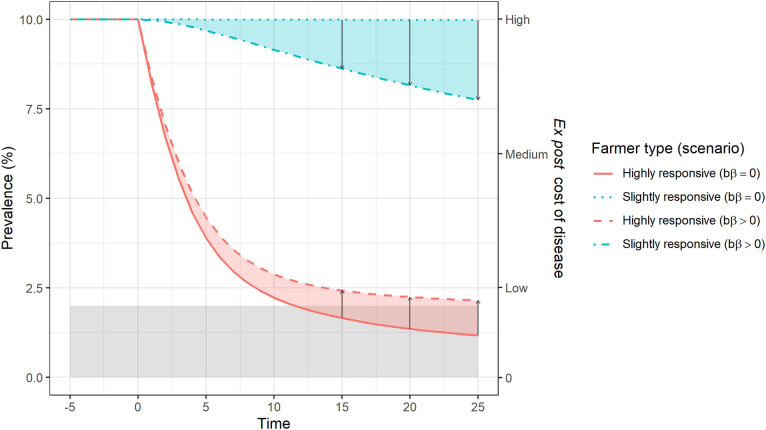
Figure 2.
Externalities occurring as a result of different effort to achieve disease control in two neighboring farms. Arrows indicate a simulation scenario shift, from absence of transmission between farms (bβ = 0) to a situation in which between-farm transmission is possible (bβ > 0). Assuming an ex post cost per infected animal per time step (δ) of 50 monetary units, the labels “Low,” “Medium,” and “High” on the right vertical axis correspond to 313, 781, and 1,250 monetary units. Blue and red shaded areas correspond to the positive and negative externalities, respectively. The gray shaded area indicates the target prevalence level from society's perspective (<2%).

