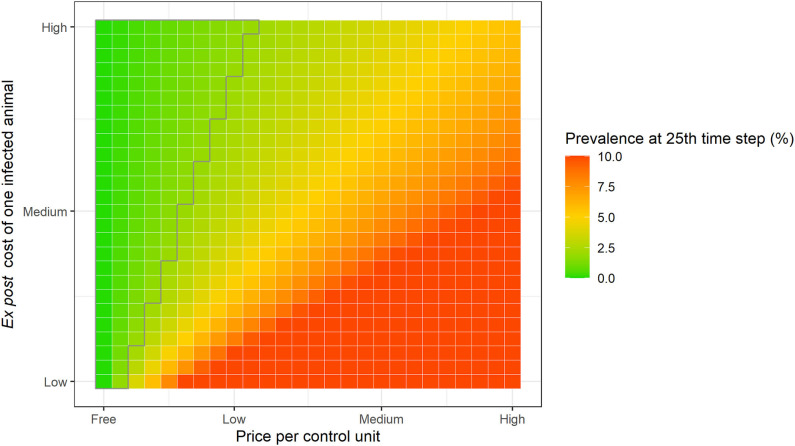
Figure 4.
Predicted prevalence at 25th time step for different values of price per control unit (“Free” = 0.00; “Low” = 0.40; “Medium” = 0.85; and, “High” = 1.25 monetary units) and ex post cost per infected animal (“Low” = 10; “Medium” = 46; and, “High” = 85 monetary units), assuming privately optimal behavior in a single farm. The polygon with gray border indicates the target prevalence level from society's perspective (<2%).

