Figure 7.
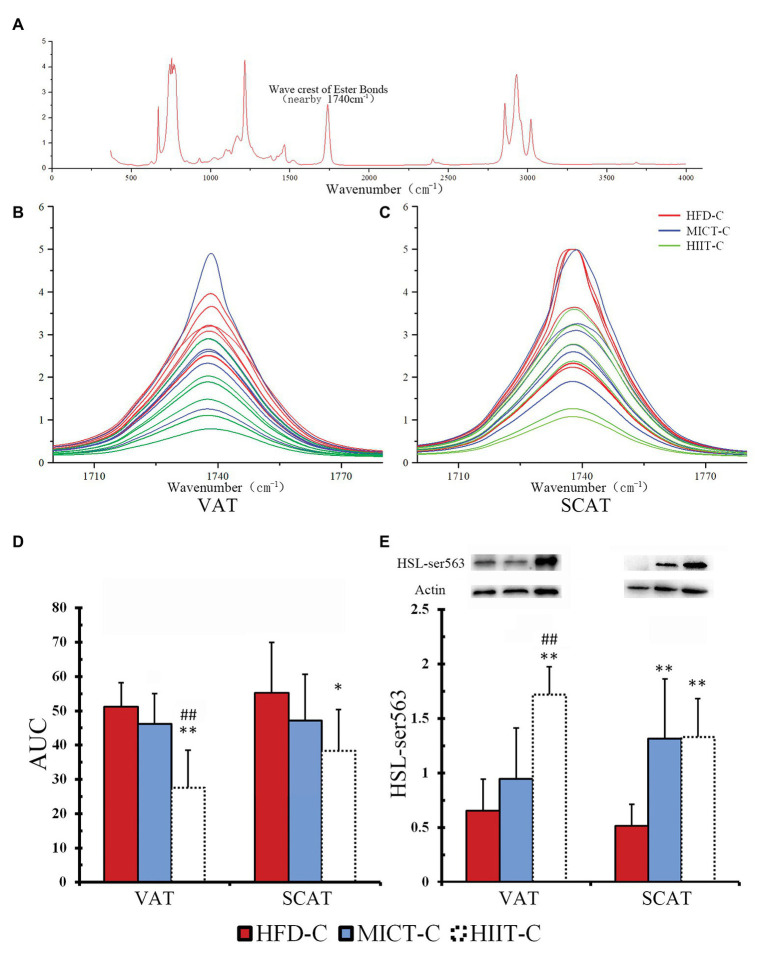
A complete FTIR spectrum (A) is shown, including a peak nearby 1,740 cm−1 representing the quantity of triglyceride bonds. Peaks of VAT (B) and SCAT (C) are overlapped to show the difference between HFD-C, MICT-C, and HIIT-C. The area under the curve (AUC), representing the quantity of triglyceride bonds. Differences are shown in the amount of triglyceride bonds (D) and HSL-Ser563 phosphorylation (E) between HFD-C, MICT-C, and HIIT-C after physiological concentration of epinephrine stimulation (simulated fasting in vitro). *p < 0.05 vs. HFD-C; **p < 0.01 vs. HFD-C; and ##p < 0.01 HIIT-C vs. MICT-C. Bands shown are representative for overall results.

