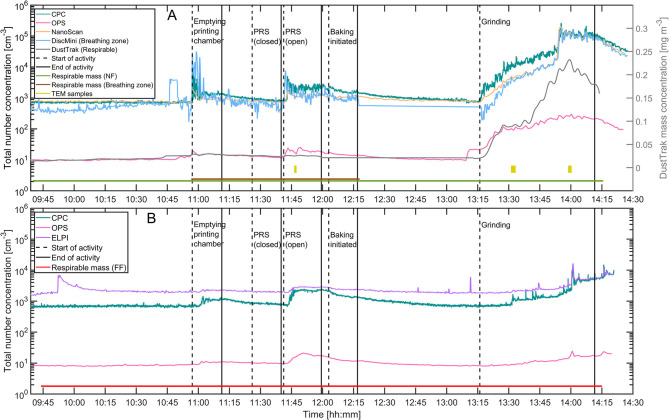
Figure 2.
Total number concentrations and respirable mass measured in the NF and BZ (A) and FF (B). Start and end of activities are indicated with dashed and full lines, respectively. Times where respirable mass of filter samples and SEM samples were collected are indicated with horizontal lines at the bottom.

