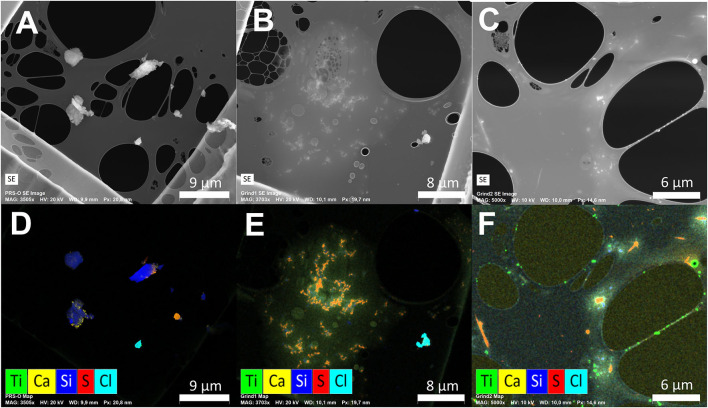
Figure 5.
Representative SE images (A–C) and overlaying EDS maps of select elements (D–F) from the PRS-O sample (A,D), Grind1 sample (B,E), and Grind2 sample (C,F). The EDS maps were generated based on X-ray counts in the energy range corresponding to an emission from the given element. The individual element maps were those used for segmentation prior to quantification.

