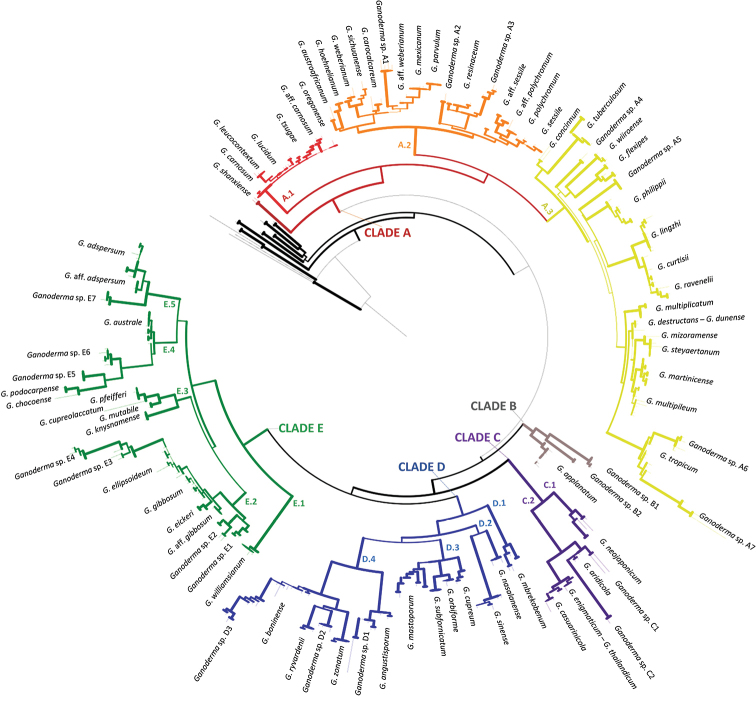
Figure 3.
Summary tree of the genus Ganoderma inferred from ML analysis, based on ITS sequence data (main dataset, DS; Table 2). Thick lines represent ML bootstrap values (BS) ≥ 65% and Bayesian Posterior Probabilities (BPP) ≥ 0.95. Clades and Clusters within the tree appear as presented in Table 1 and Suppl. material 1: Table S2. Species names correspond to those inferred in this study. Scale bar: 0.01 nucleotide substitutions per site.

