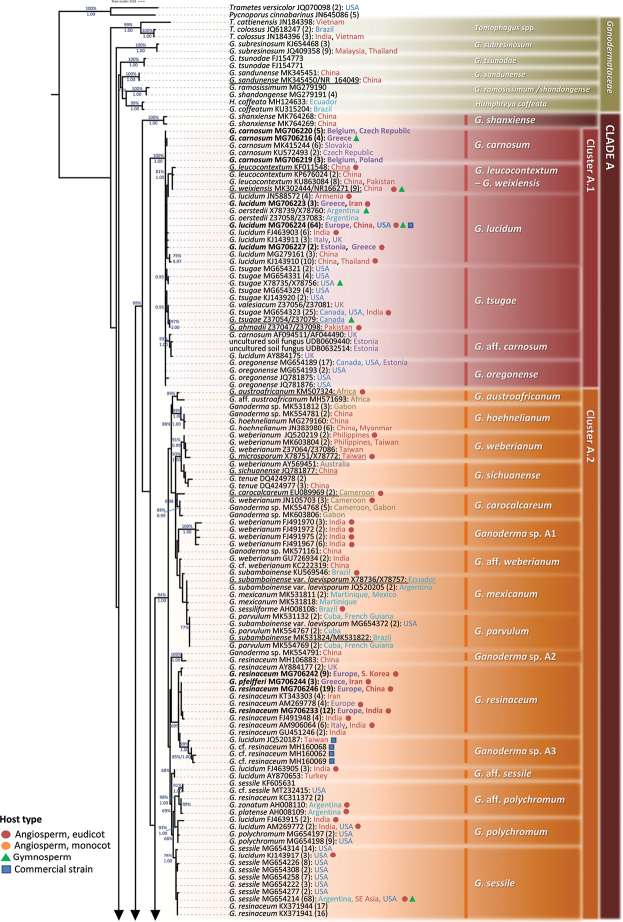
Figure 4.
Detail from Fig. 3. Phylogenetic reconstruction of the genus Ganoderma inferred from ML analysis, based on ITS sequence data (main dataset, DS; Table 2) for Clade A, Clusters A.1 and A.2. ML bootstrap values (BS) ≥ 65% and Bayesian Posterior Probabilities (BPP) ≥ 0.95 are shown. Sequences names on the left appear as initially labelled and are followed by the respective GenBank/ENA/DDBJ or UNITE accession number, while the total number of identical entries corresponding to a particular sequence is placed in parentheses, followed by the type of host plant (legend for the coloured shapes is found at the lower left side of tree) and geographic origin of the respective material (the latter appears in different font colour depending on the continent of provenance; see also Table 1 and Suppl. material 1: Table S2). Species names on the right correspond to those inferred in this study evaluated in conjunction with literature data. Sequences generated in the present work appear in bold typeface, while underlined sequences are those originating from type material. Scale bar: 0.01 nucleotide substitutions per site.

