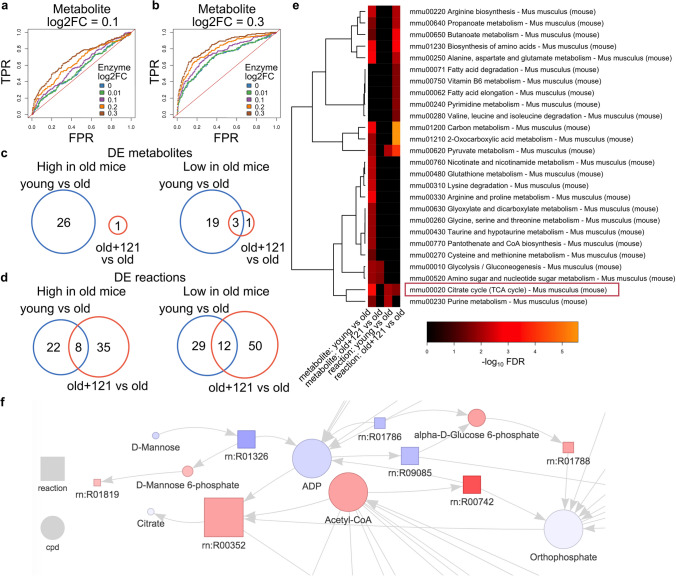
Fig. 2.
SUMMER helps to reveal biological signals. a, b Receiver Operating Characteristic (ROC) curve of simulated data with log2 fold-change (log2FC) = 0.1 (a) and 0.3 (b). FPR false positive rate, TPR true positive rate. c Venn diagram of overlapping Differentially Expressed (DE) metabolites between two tests: young vs old and old + 121 versus old. d Venn diagram of overlapping DE reactions between two tests: young vs old and old + 121 versus old. e Heatmap of significantly enriched KEGG pathways terms identified using DE metabolites/reactions of the two tests. FDR false discovery rate. f Network connected by the three common DE metabolites identified by two tests. Data presented using old + 121 versus old dataset. The interactive form of the whole network is included in Supplemental File 1. Color intensity indicates log2FC, red up-regulation, blue down-regulation, node size represents node connectivity, cpd compound (metabolite)

