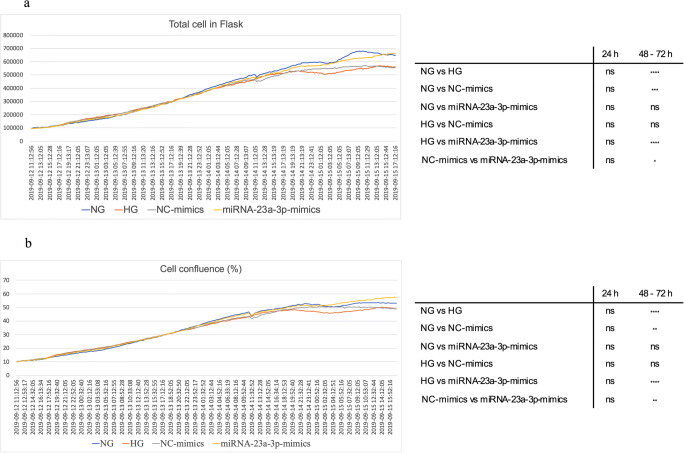
Figure 2.
Real-time cell proliferation curves for cell cultures all curves were normalized to the NG group as described in the “Statistical analysis” section. (a) Cell count proliferation. (b) Cell confluence proliferation. The total number of cells or cell confluence in four group samples were counted every 20 min for 78 h. The statistical results are shown in the right matrix (n = 234). ns not significant, *p < 0.05, ***p < 0.001, ****p < 0.0001.

