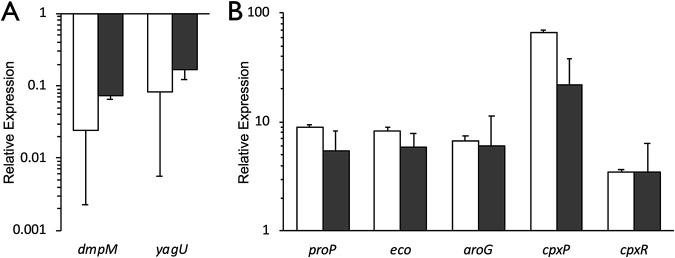
FIG 2.
Verification of RNA sequencing results by quantitative reverse transcriptase PCR (RT-PCR). Differential expression of genes that were downregulated (A) or derepressed (B) in the tyrR mutant as measured by RNA-Seq (white bars) and quantitative RT-PCR (gray bars). Relative expression was determined using the threshold cycle (ΔΔCT) method for quantitative RT-PCR by comparing against the respective wild-type transcripts. The results are normalized against recA expression levels. Data represent the average from at least three biological replicates; error bars represent the standard error of the mean.

