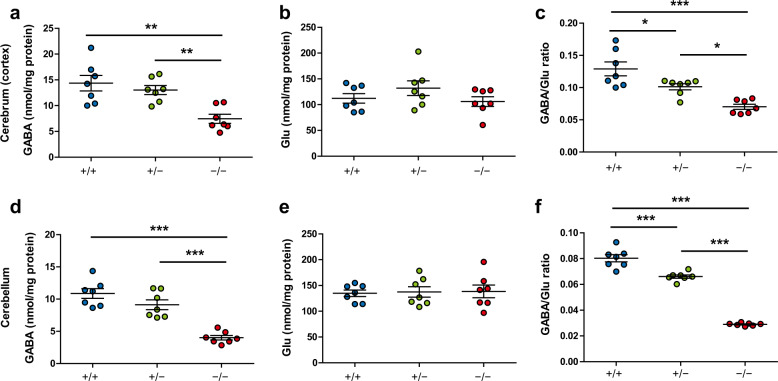
Fig. 2. GABA and glutamate concentrations in the brains of Gad1 knockout rats.
Brain samples were collected from P20 to P24. a In the cerebral cortex, the GABA concentration in Gad1−/− rats was reduced to 51.88% of that of Gad1+/+ (F(2, 18) = 16.748, p < 0.001). b There were no differences in the glutamate (Glu) concentrations among the three genotypes in the cerebral cortex (F(2, 18) = 1.4734, p = 0.2555). c The GABA/Glu ratio was reduced in both Gad1+/− and Gad1−/− rats in the cerebral cortex (F(2, 18) = 10.578, p < 0.001). d GABA concentrations in the cerebellum (F(2, 18) = 29.646, p < 0.001). e Glu concentrations in the cerebellum (F(2, 18) = 0.0372, p = 0.9636). f GABA/Glu ratios in the cerebellum (F(2, 18) = 218.79, p < 0.001). n = 7 in each genotype. The results are presented as the average ± SEM. The data were analyzed using one-way ANOVA and post hoc test adjusted by Holm’s method for multiple comparisons. *p < 0.05, **p < 0.01, ***p < 0.001.

