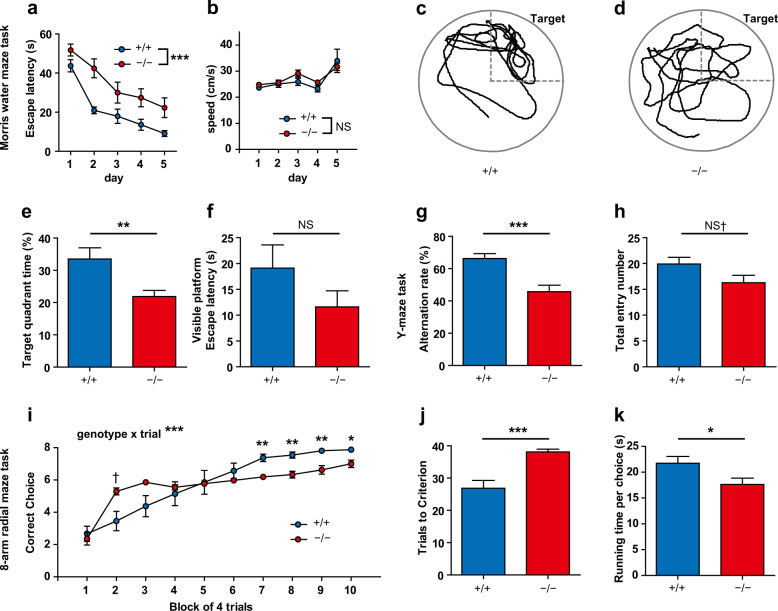
Fig. 5. Spatial cognitive impairments in Gad1−/− rats.
Gad1−/− rats displayed significant cognitive impairments in multiple tasks. a–f Morris water maze task (Gad1+/+, n = 12; Gad1+/+, n = 12). Gad1−/− rats required a longer time to reach the hidden platform during the 5-day training period (main effect of genotype, F(1, 22) = 20.4574, p < 0.001) (a). However, the swimming speed of the Gad1−/− rat was very similar to that of the Gad1+/+ rat (main effect of genotype, F(1, 22) = 0.5307, p = 0.4740) (b). Representative trajectories of Gad1+/+ (c) and Gad1−/− (d) rats in the probe test. The target quadrant is shown in the panels. In Gad1−/− rats, the accumulation of the trajectory to the target was decreased. The percentage of time spent within the target quadrant was significantly reduced in Gad1−/− rats compared with Gad1+/+ rats (t(17.033) = −2.9599, p < 0.01) (e). There was no significant difference between genotypes in the visible platform task (t(19.591) = −1.3764, p = 0.1842) (f). g–h Y-maze test for working memory (Gad1+/+, n = 12; Gad1+/+ n = 11). Gad1−/− rats showed less alternation behavior than Gad1+/+ rats (t(18.877) = –4.0583, p < 0.001) (g). The number of entries to arms was also slightly decreased in Gad1−/− rats (t(20.453) = –1.8815, p = 0.07422) (h). i–k Eight-arm radial maze task for working memory (Gad1+/+, n = 12; Gad1−/−, n = 12). Gad1−/− rats showed a different pattern in the learning curve from that of Gad1+/+ rats (genotype × trials, F(9, 198) = 9.1844, p < 0.001). At the end of the training, the number of correct choices was less in Gad1−/− rats than in Gad1+/+ rats (simple main effects of genotype, adjusted by Holm’s method; 7th to 9th, p < 0.01; 10th, p < 0.05). However, in the second block, Gad1−/− rats transiently scored higher than WT rats (2nd, p = 0.05227) (i). Gad1−/− rats also needed more trials to reach the learning criterion of the task (t(13.78) = 4.3409, p < 0.001) (j). Running time per choice was decreased in Gad1−/− rats (t(21.868) = 2.3065, p < 0.05) (k). The results are presented as the average ± SEM. Data were analyzed using two-way repeated measures ANOVA (a, b, i) and Welch’s t-test (e–h, j, k). †p < 0.1, p < 0.05, **p < 0.01, ***p < 0.001; NS, not significant.

