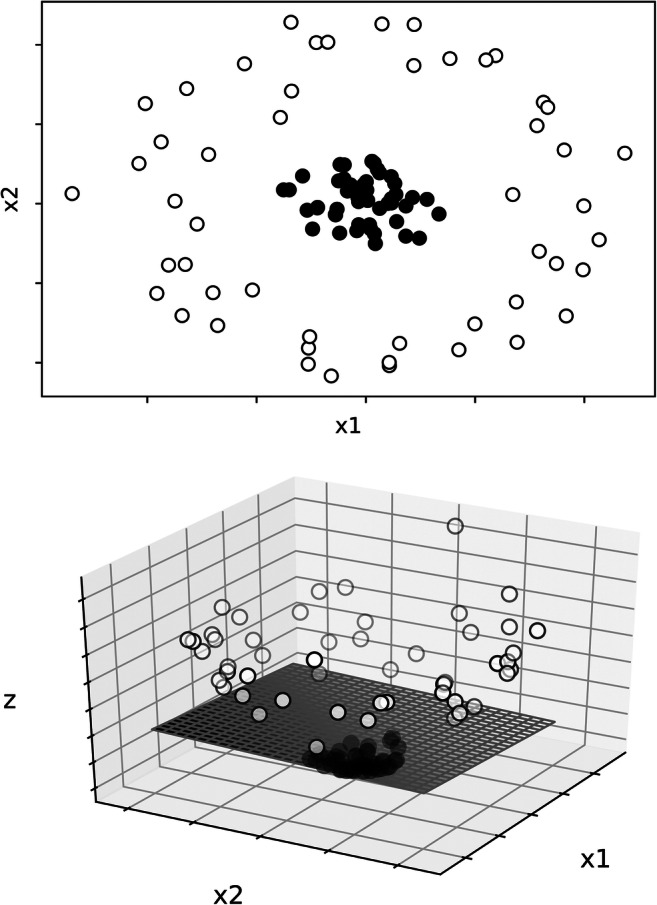
Fig. 3.

Example of a Dataset Separated by a Support Vector Classifier. Note. The upper panel shows a two-dimensional graph representing two features: x1 and x2. Closed points represent one category and opened points a different category. The lower panel depicts the addition of a higher dimension (z) and a linear plane that separates the two categories. Reprinted with permission from “Machine Learning to Analyze Single-Case Data: A Proof of Concept” by M. J. Lanovaz, A. R. Giannakakos, and O. Destras, 2020, Perspectives on Behavior Science (doi:1.1007/s40614-020-00244-0). CC BY 4.0
