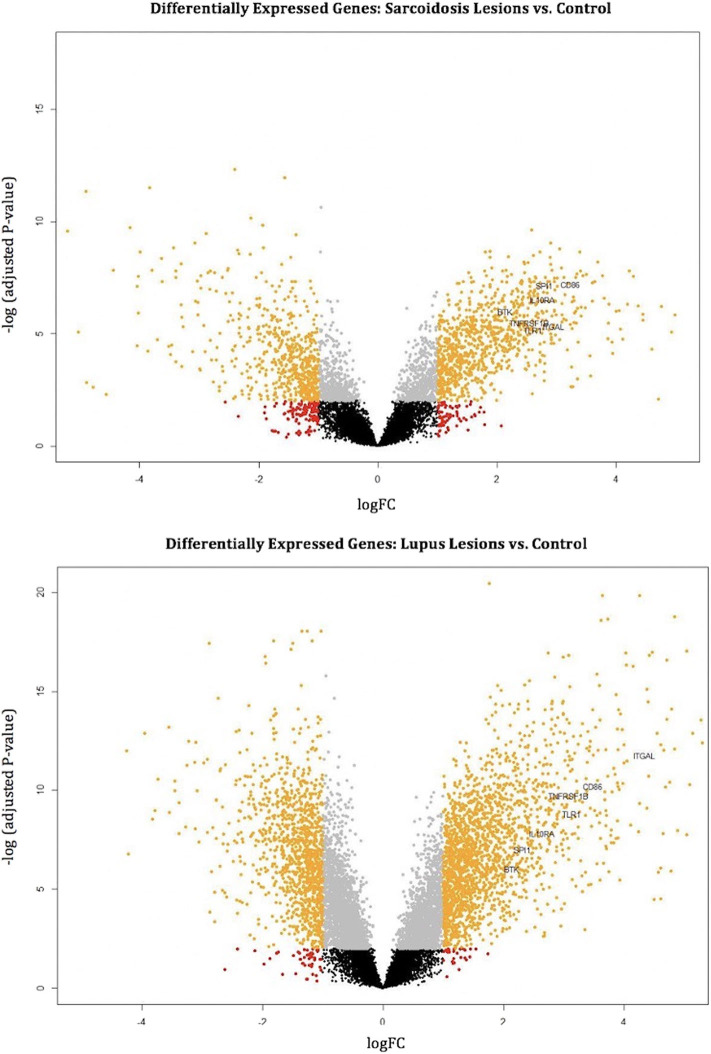
Figure 3.
Volcano plots mark differentially expressed genes (orange dots) in cutaneous sarcoidosis lesions vs. control (top) and discoid lupus erythematosus lesions vs. control (bottom). The orange dots represent differentially expressed genes using the criteria of p < 0.01 and log2 (fold-change). Black, gray, and red dots are genes that do not meet the criteria of a differentially expressed gene. The common hub genes (TLR1, ITGAL, TNFRSF1B, CD86, SPI1, BTK, and IL10RA) are marked.

