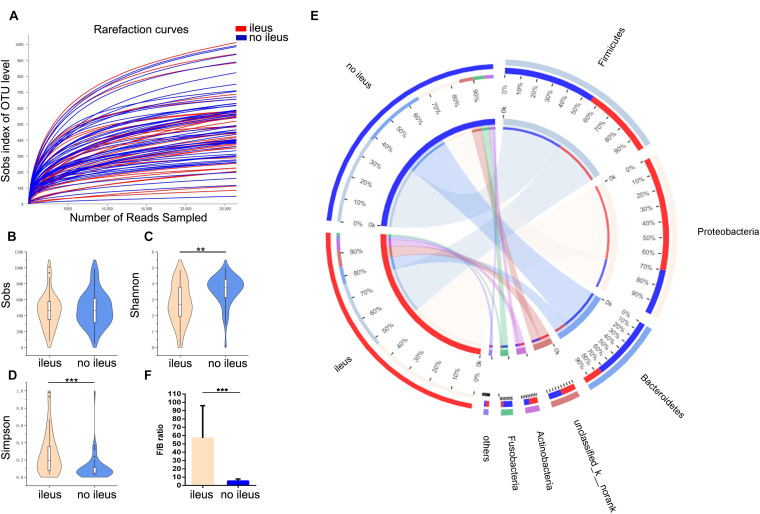
FIGURE 1.
The shift of the gut microbiota composition in CRC patients with or without ileus. (A) The rarefaction curve reached a plateau, indicating that the sequencing depth was adequate. (B–D) The Sobs index, Shannon index, and Simpson index of the ileus and no-ileus groups were compared. (E) In the Circos plot, the small semicircle (left half circle) represents the species composition in the sample. The color of the outer ribbon represents the groups, the color of the inner ribbon represents the species, and the length of the ribbon represents the relative abundance of the species in the corresponding sample. The large semicircle (right half circle) indicates the distribution proportion of species in different samples at this taxonomic level. The color of the outer ribbon represents the species, the color of the inner ribbon represents the groups, and the length of the ribbon represents the relative abundance of the species in the corresponding sample. (F) The Firmicutes-to-Bacteroidetes ratio of the ileus and no ileus groups. Data are expressed as the means ± SD. The Wilcoxon rank-sum test, **p < 0.01, ***p < 0.001.

