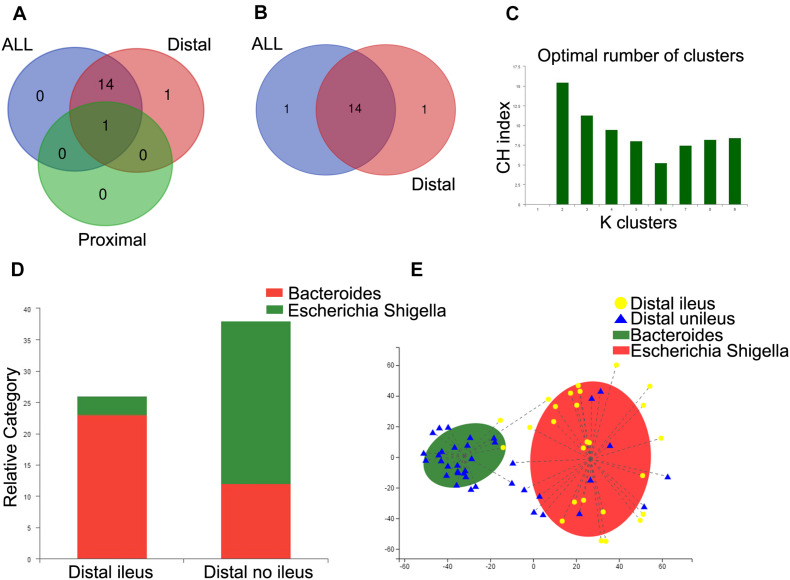
FIGURE 4.
Enterotype analysis of distal CRC patients. (A,B) Venn diagram showing the common genera between groups. (C) When the values were fit to the partitioning around medoids, the optimal classification into two community types was indicated. (D) Distribution of the distal ileus and distal no-ileus samples in the community types. The areas of the columns are scaled to the sample size. Fisher’s exact test, p = 0.000002. (E) Plot of principal coordinate analysis of stool samples using partitioning around medoids.

