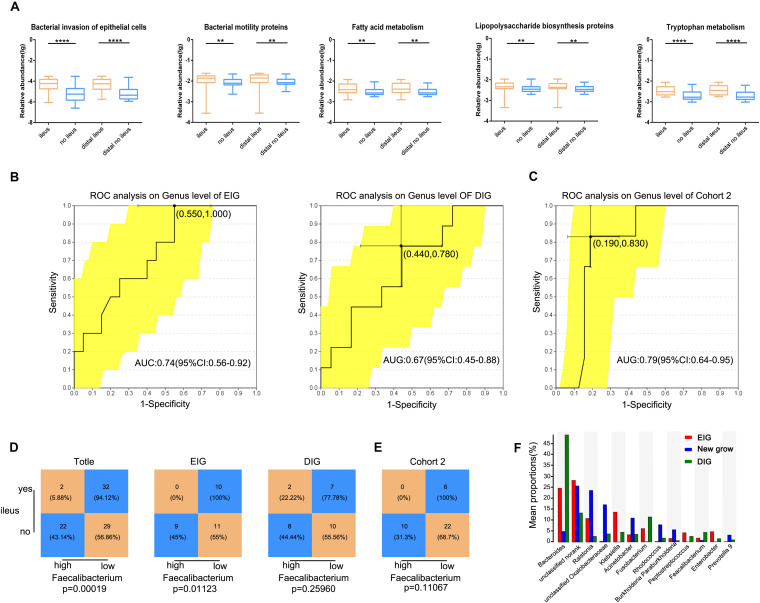
FIGURE 5.
Gut microbiota prediction of postoperative ileus. (A) The five typically different KEGG pathways for the ileus, no-ileus, distal ileus, and distal no-ileus groups. The Wilcoxon rank-sum test. Receiving operating characteristic curve analysis was used to assess the predictive model performance of (B) EIG, DIG, and (C) Cohort 2. Statistical analysis was conducted based on the amount of Faecalibacterium and the ileus rate in (D) Cohort 2, EIG, DIG, and (E) Cohort 3 by the cutoff value of Faecalibacterium defined in Cohort 2, Chi-square test. (F) The abundance of the gut microbiota in the EIG, DIG, and new groups. **p < 0.01, ****p < 0.0001, EIG, ileus in the postoperative perioperative period; DIG, ileus within the first 6 months after hospital discharge.

