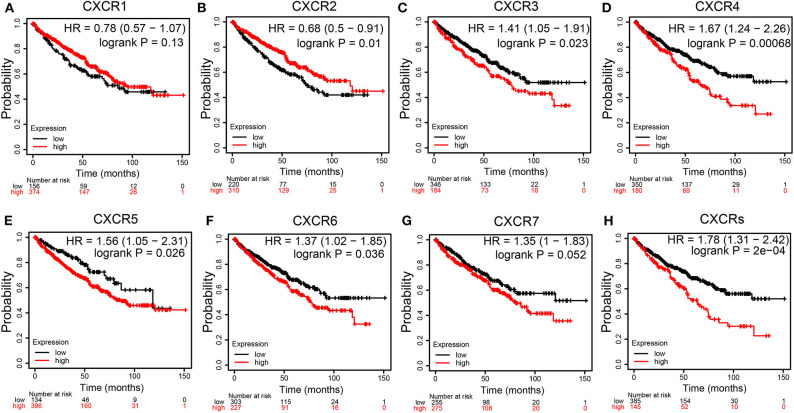
Figure 5.
Survival curves showing the overall survival (OS) times of patients with ccRCC (Kaplan–Meier Plotter). (A-G) Kaplan–Meier (KM) survival curves of CXCR family members. Among the seven CXCR family members, high mRNA expression of CXCR3 (C), CXCR4 (D), CXCR5 (E), CXCR6 (F), and CXCRs (H) were associated with worse OS in ccRCC patients. High CXCR2 (B) were correlated with longer OS time. CXCR1 (A) and CXCR7 (G) showed no significant difference.

