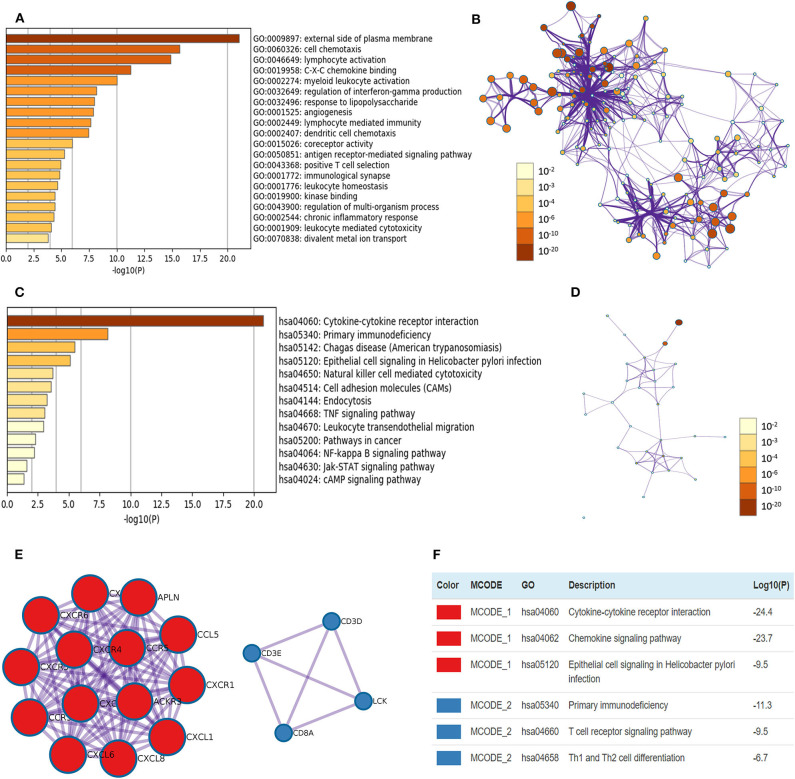
Figure 7.
The enrichment analyses of CXCR1/2/3/4/5/6/7 and their similar genes in ccRCC. (A) GO enrichment analysis predicted three main functions, including biological process, cellular components, and molecular functions (top 20, p < 0.05), and each GO term is colored based on the value of -log10 (p-value). (B) The network of Enriched GO terms. Nodes represent GO terms, and node size indicates the number of genes involved. Nodes that share the same cluster are usually close to each other, and the thicker the edge, the higher the similarity. (C) KEGG pathways colored by p-values. (D) The network of KEGG pathways colored by p-value. (E) The two most significant MCODE components form the PPI network of CXCR family members and their similar genes. (F) Independent functional enrichment analysis of MCODE components.

