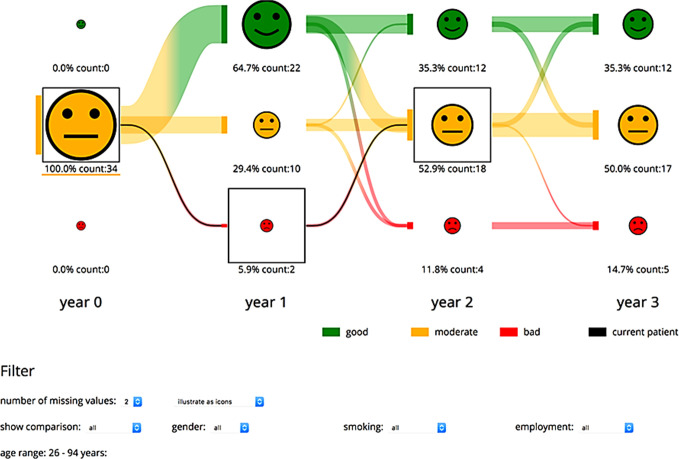
Figure 3.
Visualization of the progress of one patient compared to a selected patient group. The physician can choose the currently visualized function domain and patient group. The number of patients is represented through the icon size and additionally given as text. The development of the patients over the years is illustrated through lines between each state. The development of the current patient is given through the black lines and boxes.

