Figure 7.

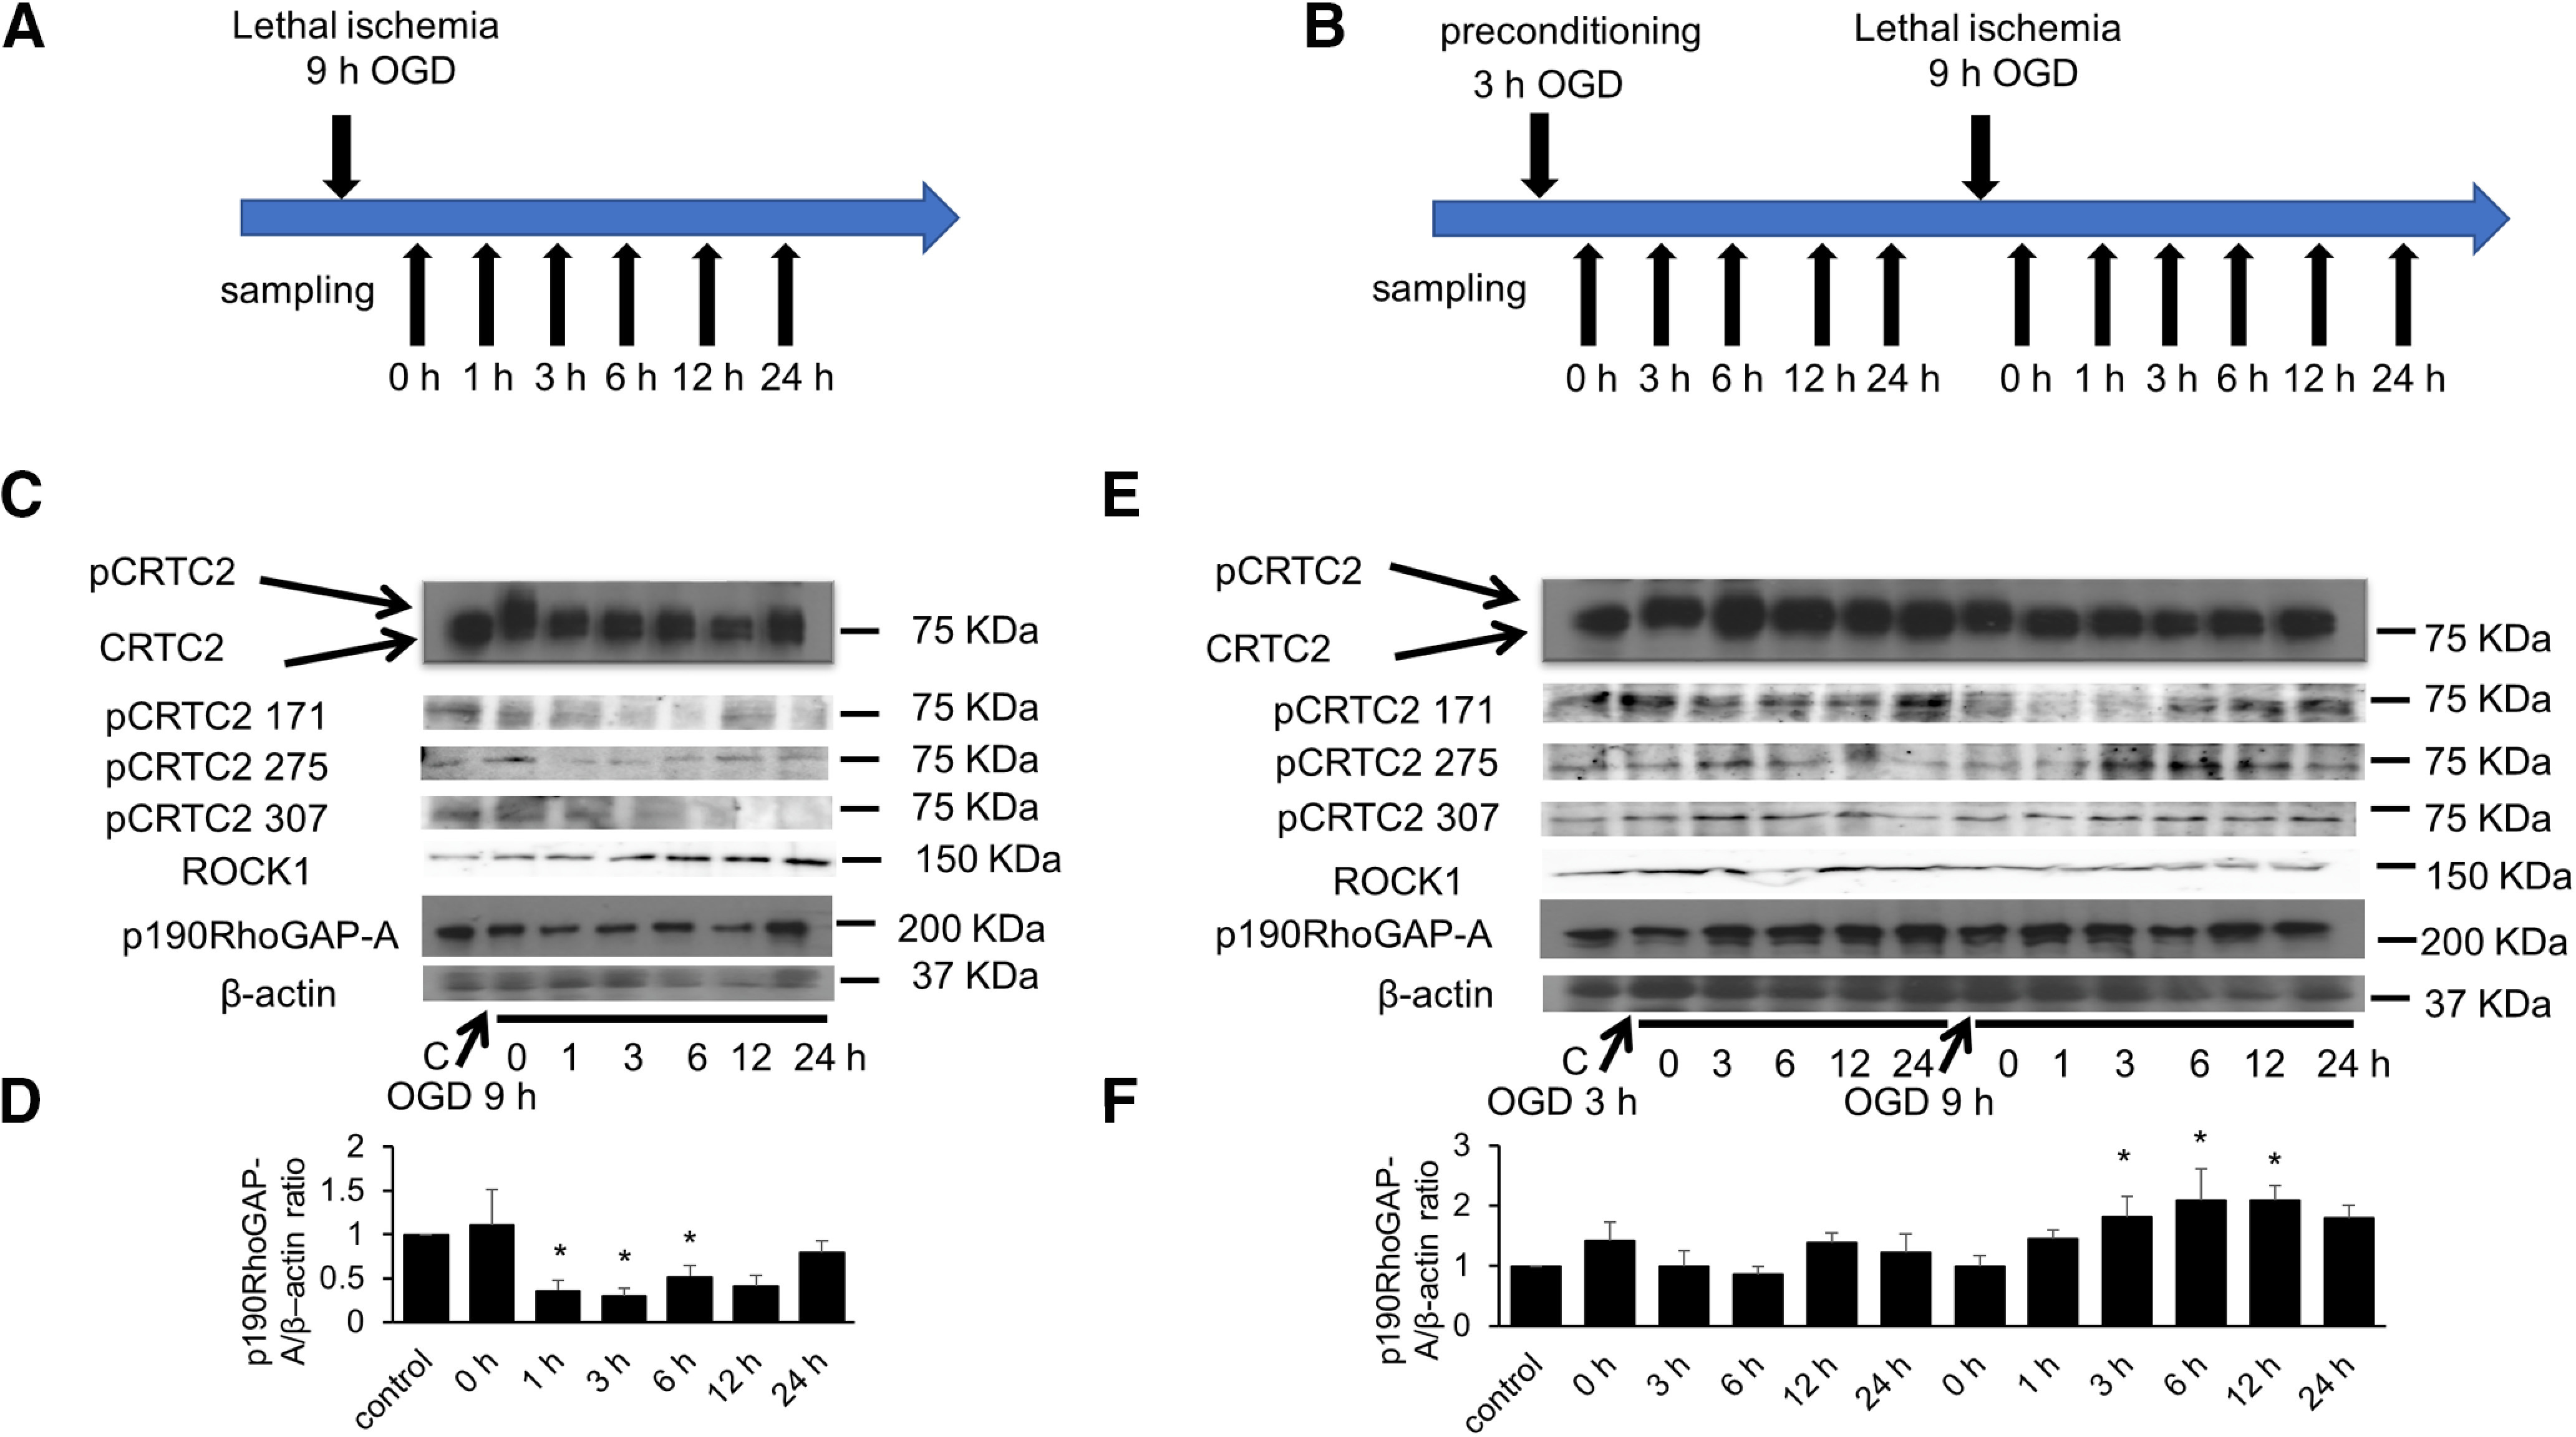
CRTC2 is related with the expression of p190RhoGAP-A under ischemic conditions. A, Experimental procedures. The cells were subjected to lethal ischemia (OGD 9 h). B, Experimental procedures. The cells were subjected to 3 h OGD before lethal ischemia (OGD 9 h). C, Western blot analysis of the phosphorylation of CRTC2 and the expression level of p190RhoGAP-A and ROCK1 in bEnd.3 cells at the indicated periods following OGD. D, Quantitative results of p190RhoGAP-A/β-actin ration are shown (n = 5). E, Western blot analysis of the phosphorylation of CRTC2 and the expression level of p190RhoGAP-A in bEnd.3 cells at the indicated periods following OGD or preconditioning OGD. F, Quantitative results of p190RhoGAP-A/β-actin ration are shown (n = 4). Quantitative results of Western blot analysis are presented as mean ± SEM. For D, F, *p < 0.05 compared with control by two-tailed unpaired Student's t test. D, 0 h, p = 0.6739; 1 h, p = 0.0216; 3 h, p = 0.0125; 6 h, p = 0.0783; 12 h, p = 0.0331; 24 h, p = 0.7357. F, 0 h (after OGD 3 h), p = 0.2968; 3 h (after OGD 3 h), p = 0.9970; 6 h (after OGD 3 h), p = 0.7349; 12 h (after OGD 3 h), p = 0.3374; 24 h (after OGD 3 h), p = 0.5648; 0 h (after 3 h + 9 h), p = 0.9925 1 h (after OGD 3 h + 9 h), p = 0.2552; 3 h (after OGD 3 h + 9 h), p = 0.0448; 6 h (after OGD 3 h + 9 h), p = 0.0085; 12 h (after OGD 3 h + 9 h), p = 0.0092; 24 h (after OGD 3 h + 9 h), p = 0.0523.
