
Figure 9.
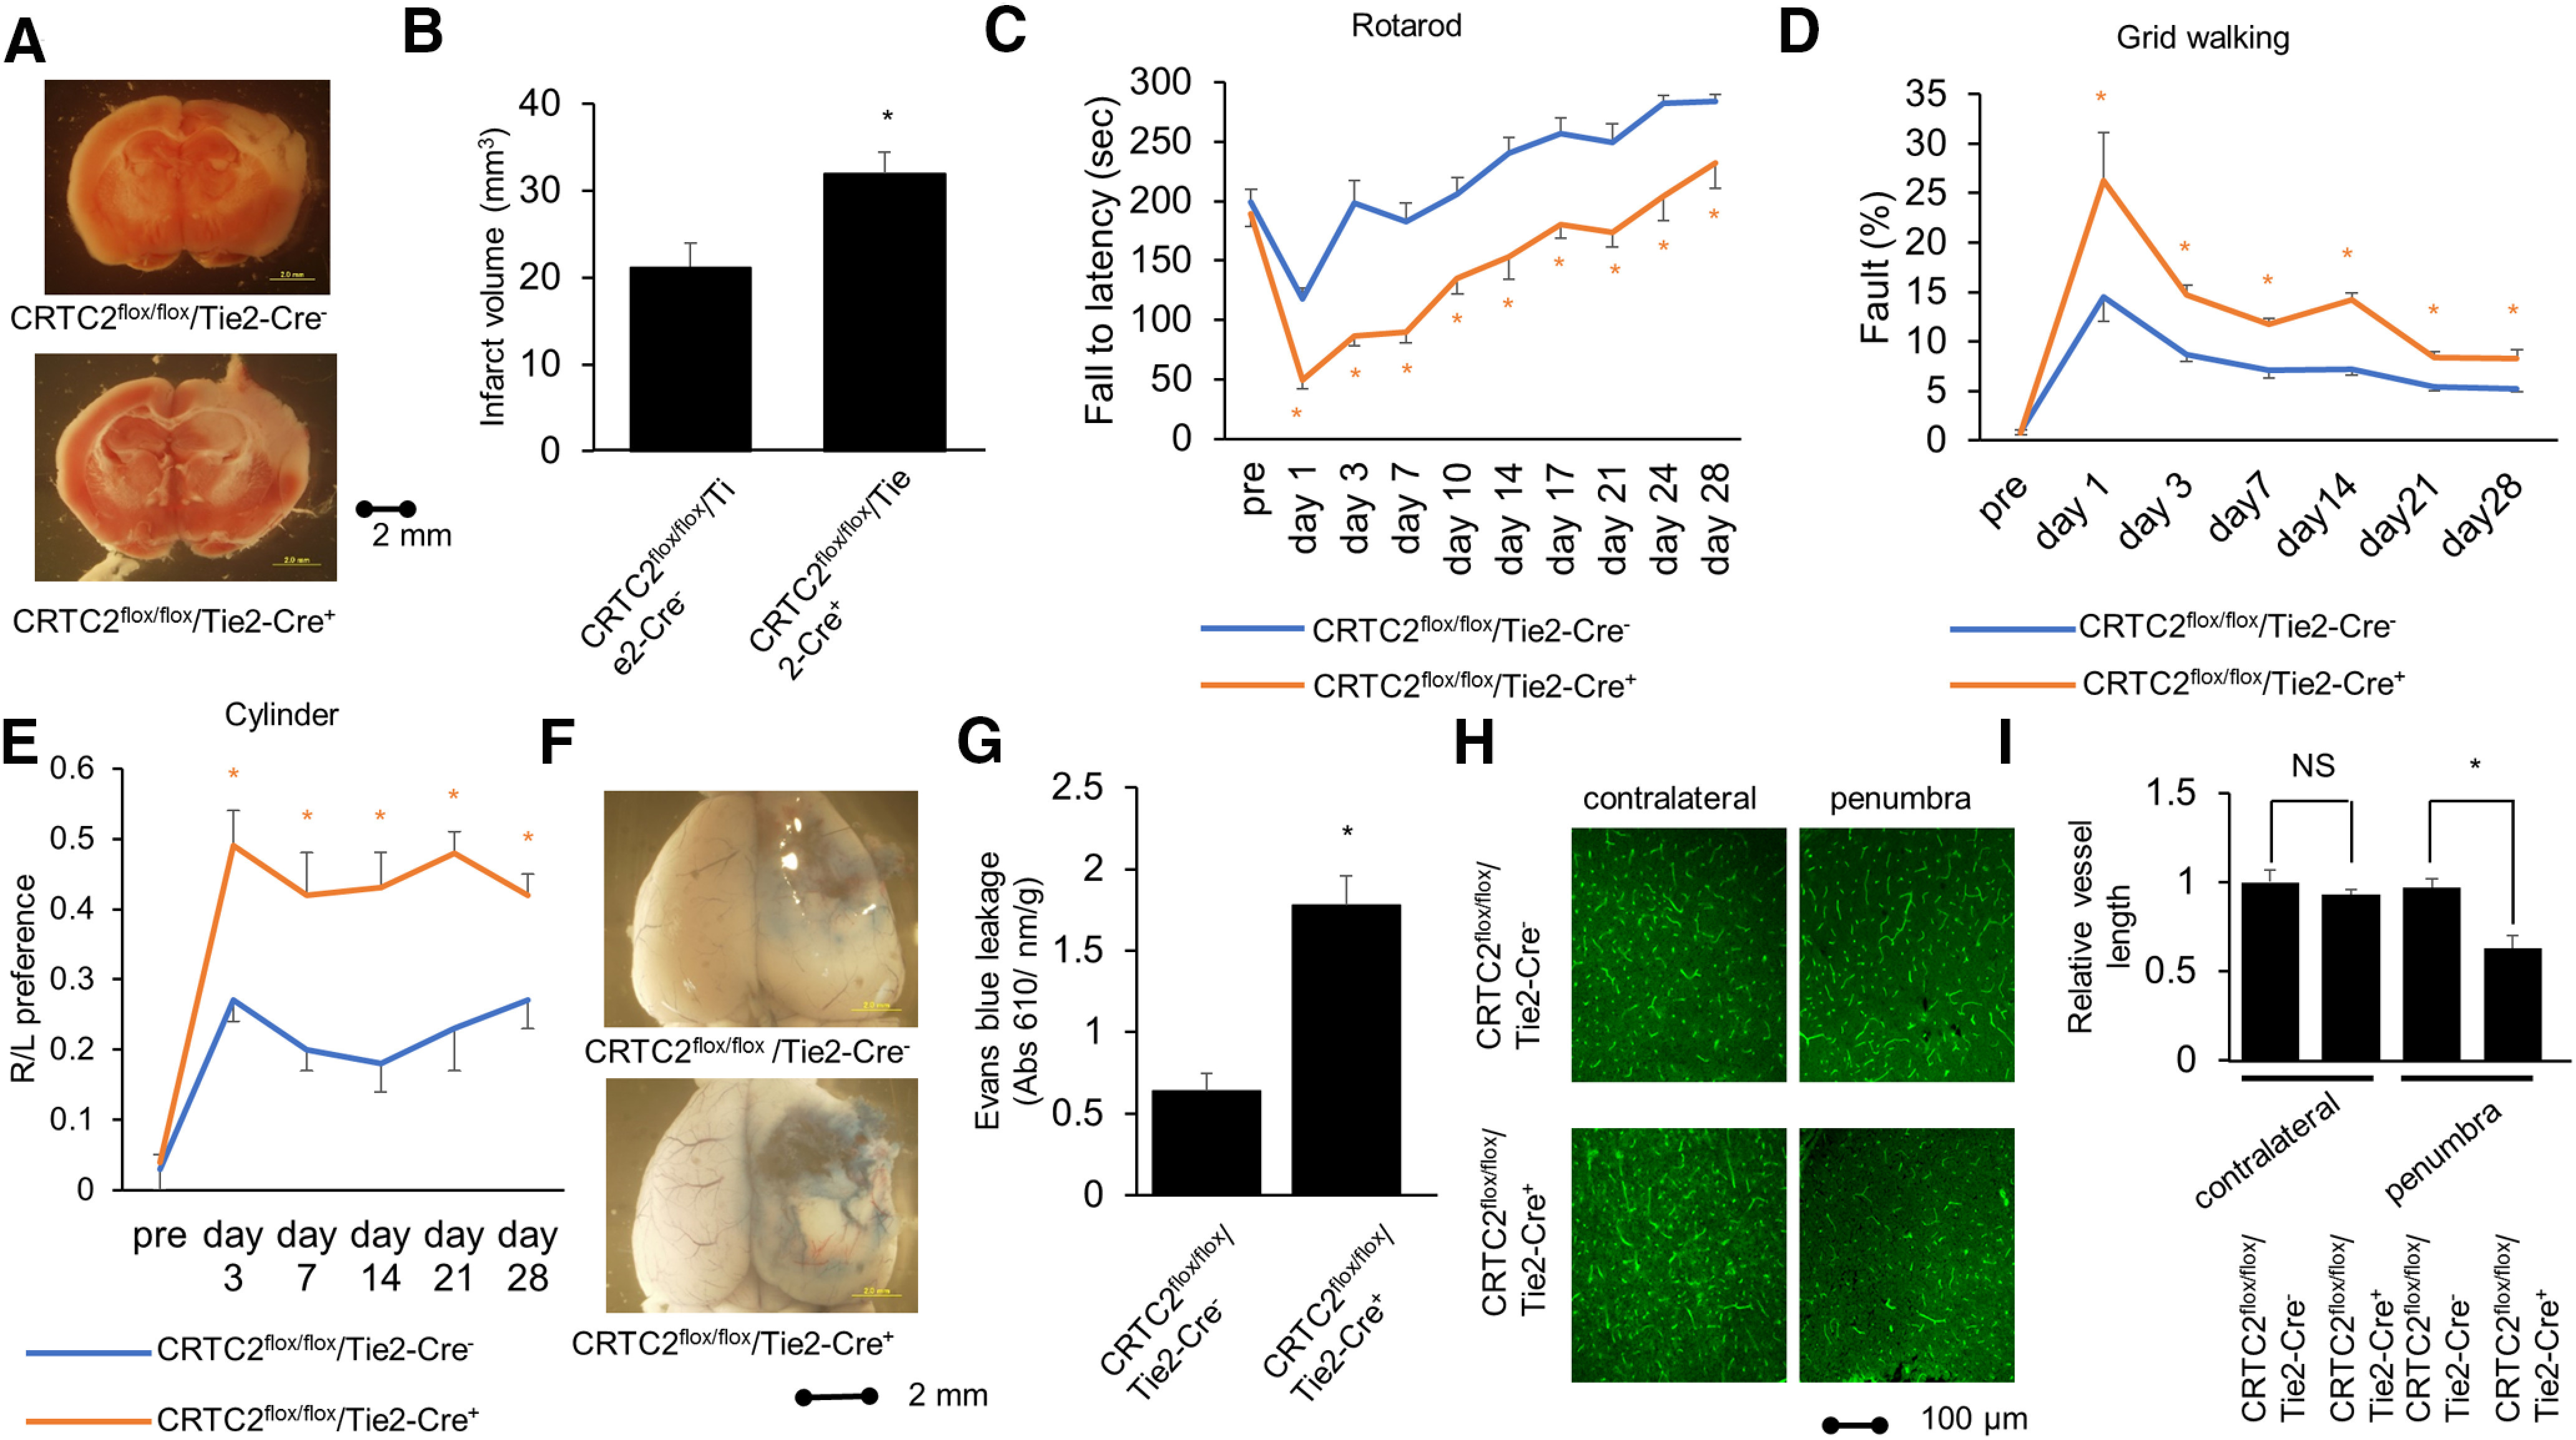
Endothelial cell-specific knock-out of CRTC2 mice show more severe ischemic stroke and impaired neurologic recovery. A, Representative images of TTC staining after PIT of CRTC2flox/flox/Cre− or CRTC2flox/flox/Cre+ knock-out mice. Scale bar: 2 mm. B, Quantitative results of infarct volume of CRTC2flox/flox/Cre– or CRTC2flox/flox/Cre+ knock-out mice (n = 5 or 7). C, Rotarod test data (n = 8–11). D, Grid walking test data (n = 7 or 8). E, Cylinder test data (n = 6–8). F, Photomicrograph of Evans Blue leakage at 1 d after PIT. Scale bar: 2 mm. G, Quantitative results of Evans Blue leakage of CRTC2flox/flox/Cre– or CRTC2flox/flox/Cre+ knock-out mice (n = 4). H, Representative image of immunostaining in the contralateral lesion and penumbra lesion of the brain at 7 d after PIT. The vessel appears green with L. esculentum lectin antibody staining. Scale bar: 100 µm. I, Quantitative results of the length of blood vessels in contralateral lesion or penumbra lesion at CRTC2flox/flox/Cre– or CRTC2flox/flox/Cre+ knock-out mice (n = 3 or 4). Error bars represent mean ± SEM. For C, D, E, G, I, *p < 0.05 compared with CRTC2flox/flox/Cre− mice by two-tailed unpaired Student's t test. For, I, NS indicates no significant change by two-tailed unpaired Student's t test.