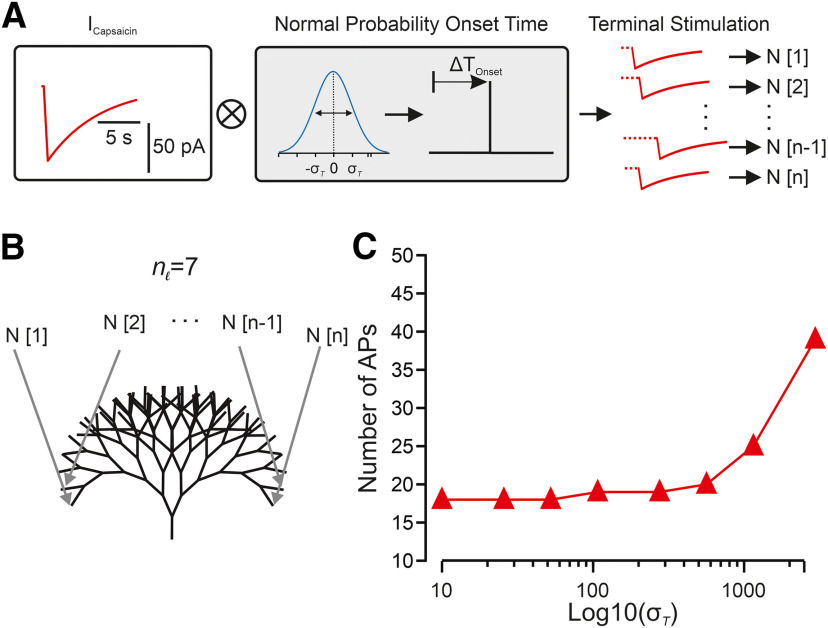
Figure 10.
Temporal summation by the nociceptive terminal tree. A, Scheme of normally distributed random time onset for a single of n terminal stimulations (N). After a capsaicin current is generated (red) its stimulation onset time is shifted to a normal distribution (blue) random onset time with a SD (σ); n stimulations are then each applied to a single terminal index with respect to its index (1..n). B, Scheme depicting the model of a seven bifurcation stage balanced binary tree. Each of the time-randomized stimulations (N[1..n]) is applied to a terminal nerve-ending (gray arrows). C, The number of APs generated as a function of the logarithmic scaling of normal distribution SD onset time of a capsaicin-like current in all terminals. The activity was measured at the central terminal.

