Figure 6.
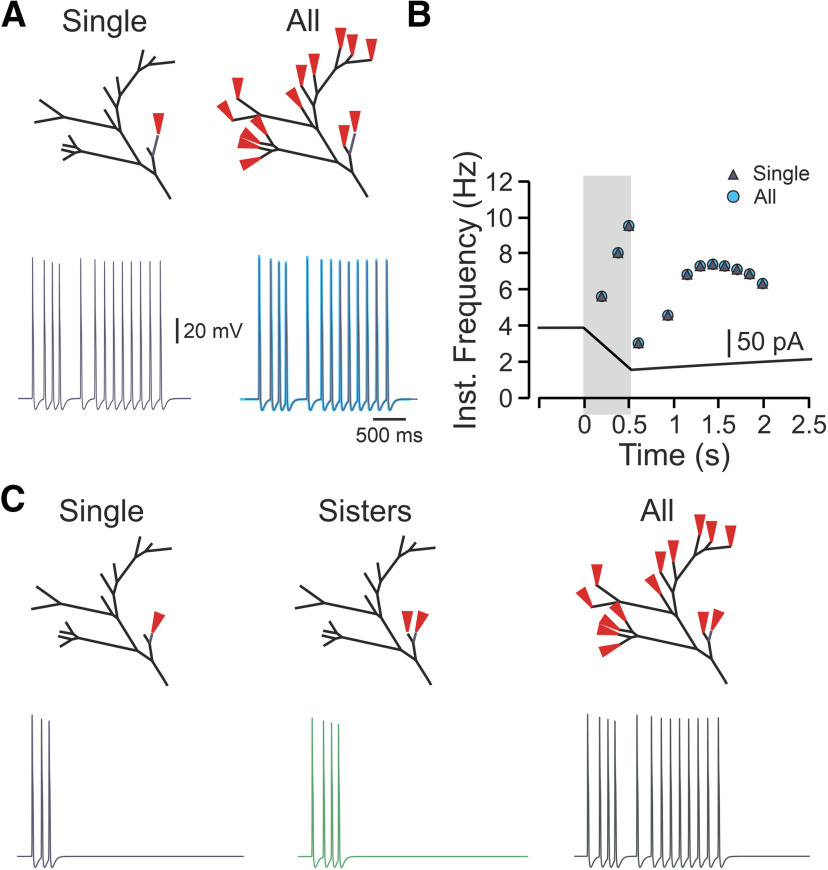
The location of a single terminal branch defines its contribution to the terminal response. A, upper panels, Schemes depicting the locations of the stimulation. Left lower panel, AP firing detected at the central terminal following stimulation of single 175 µm terminal branch located close to the terminal branch (navy blue terminal at the upper panel). Right lower panel, Superimposition of the traces obtained following stimulation of all terminal branches (light blue) and stimulation of a single 175-µm terminal branch shown in the left. Note that the firing is identical. B, Instantaneous frequencies plotted as a function of time, following stimulation by a capsaicin-like current of a single 175-µm terminal branch shown in A, left (navy blue triangle), or all terminal branches (light blue circle). Shadowed area outlines the 500 ms of a capsaicin-like current step. C, Same as A, but the terminal stimulated in A was shortened to 75 µm. The stimulation of this terminal branch resulted in the firing of three APs (lower left). The stimulation of this terminal branch, together with the similar adjacent terminal branch, led to the generation of four APs (lower middle) and was substantially lower than the firing resulted from stimulation of all the terminal branches (lower right).

