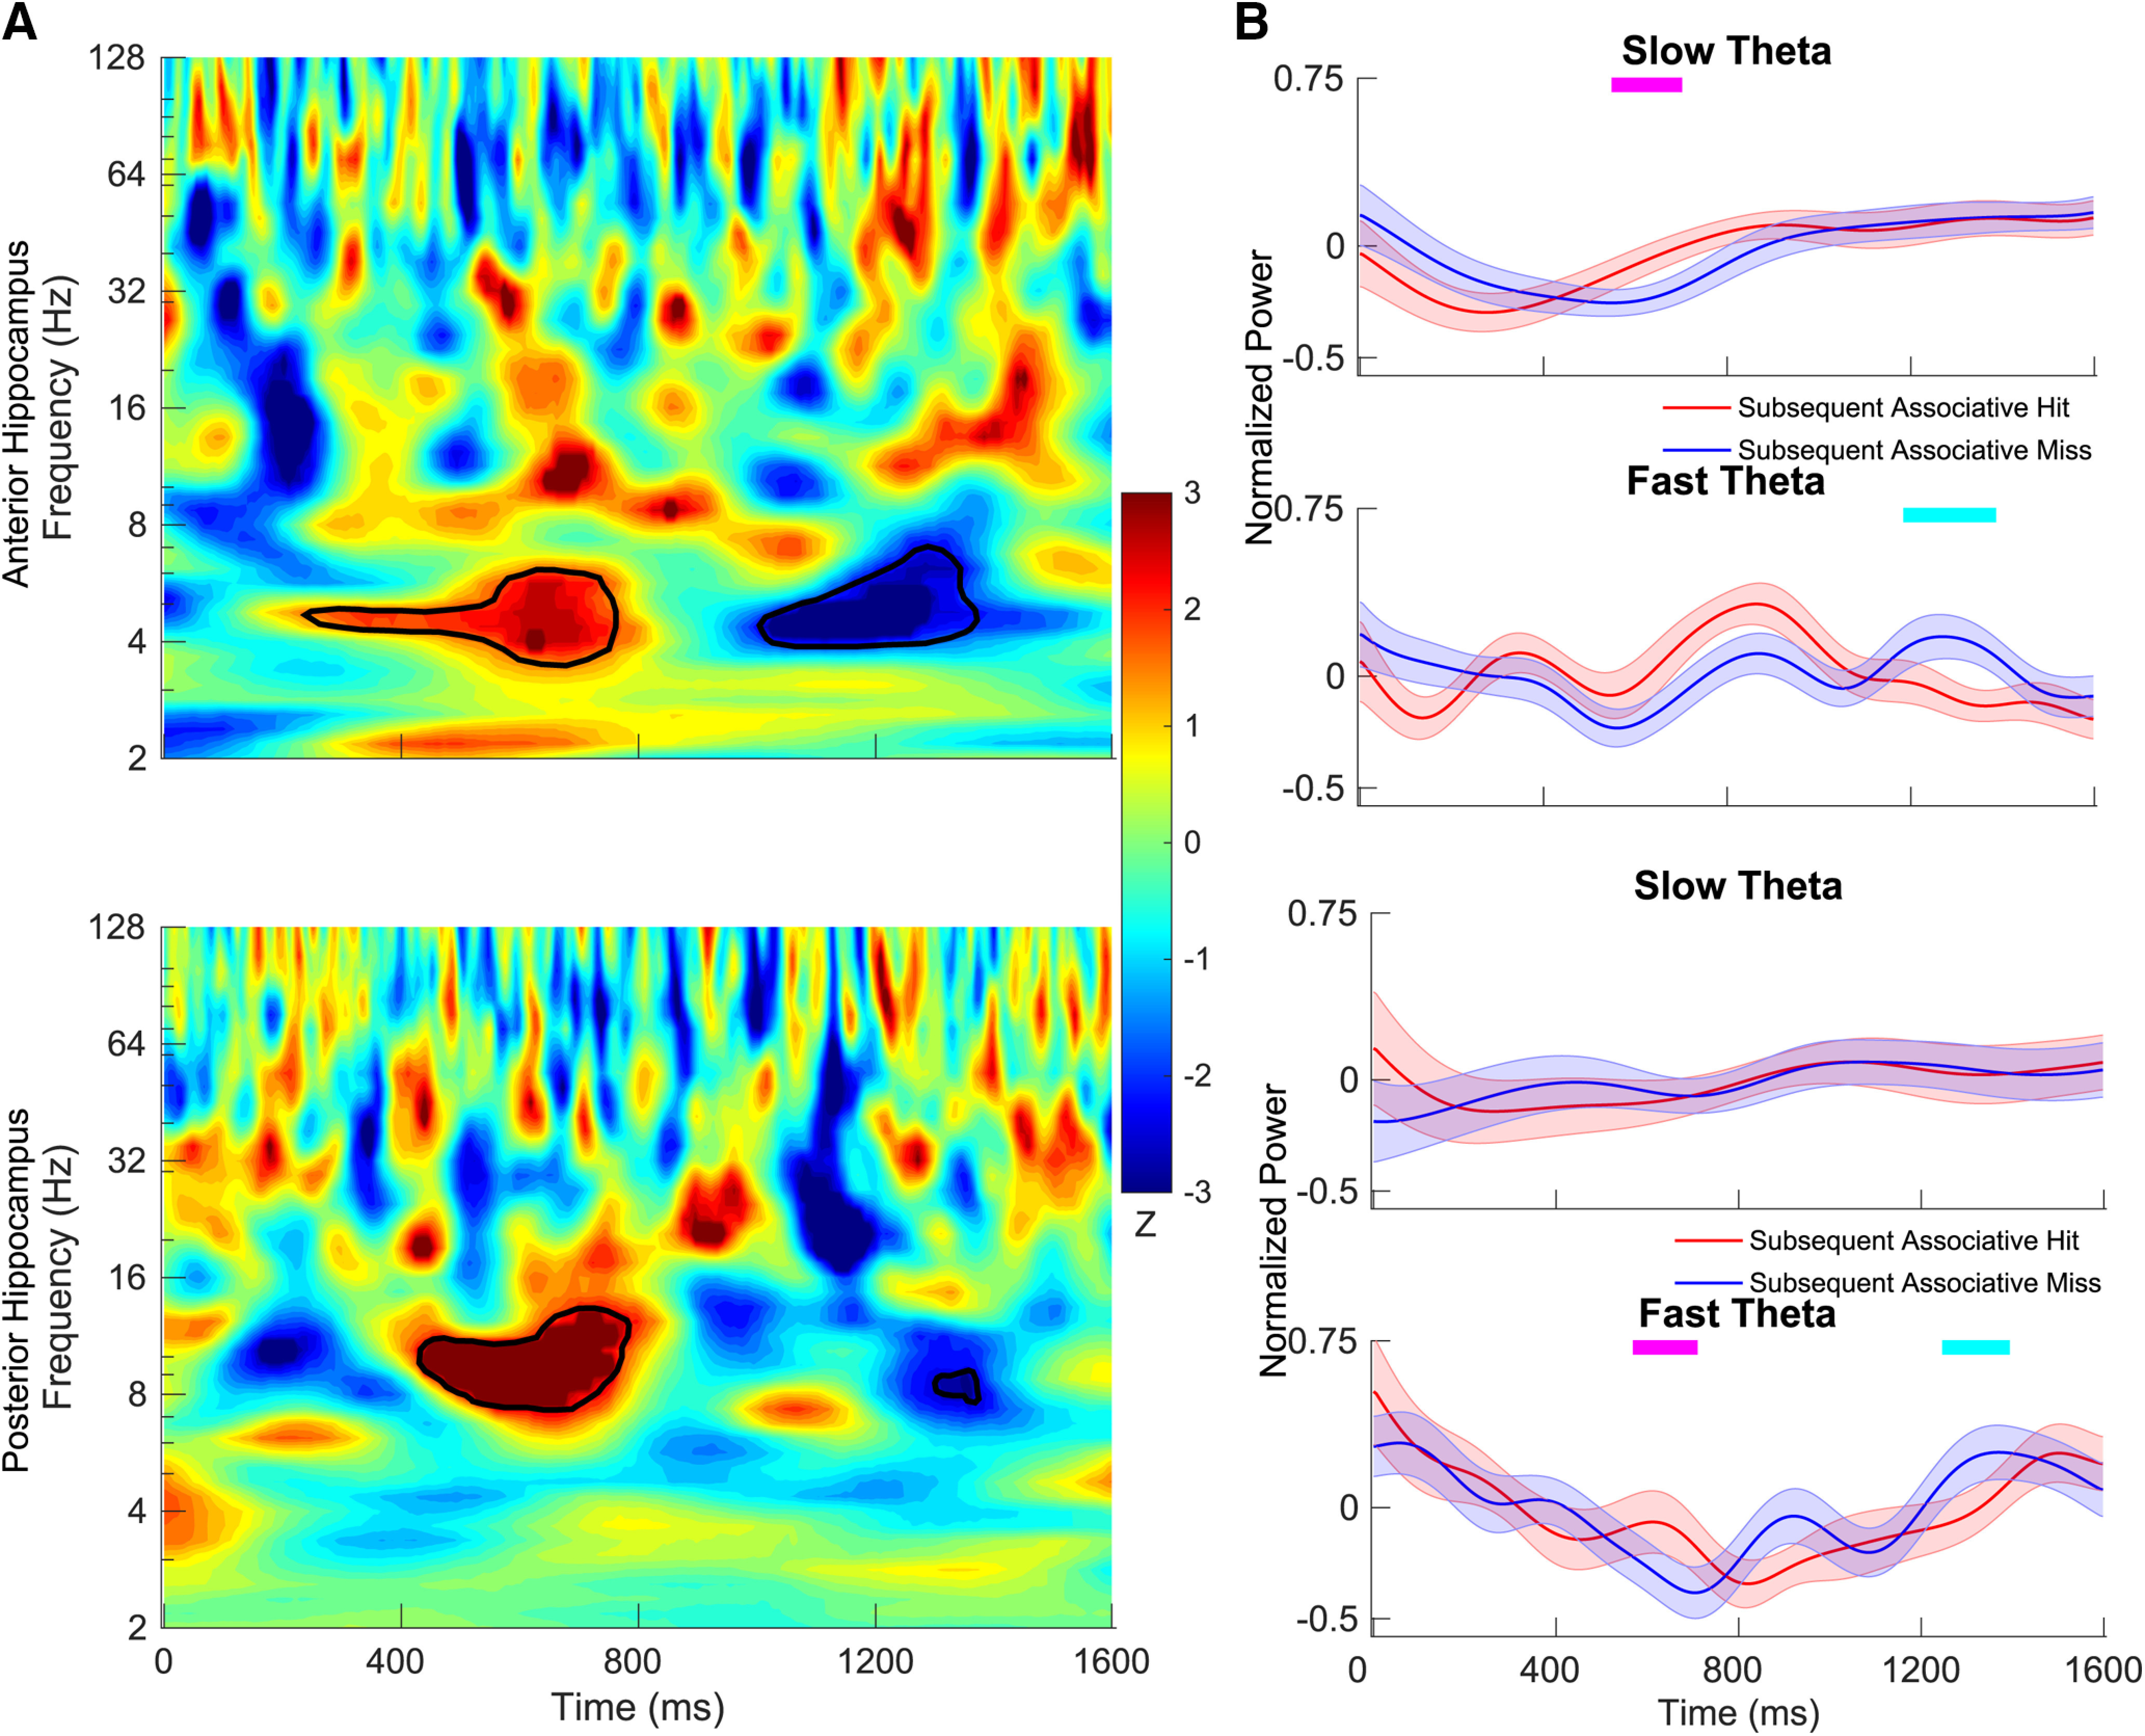
Figure 2.

Time–frequency maps comparing power during encoding between intact items that went on to be classified at test as associative hits versus misses. A, The z-scored p values are plotted for anterior hippocampus (top) and posterior hippocampus (bottom). In the time–frequency map, red indicates that the power for subsequent associative hits is higher than that for subsequent associative miss, and blue indicates the opposite. Time–frequency pixels in the shaded region in theta range (2–9 Hz) survived correction (FDR corrected p < 0.05, random-effects model with a permutation procedure across stimulus conditions). B, Aggregate normalized power for slow theta and fast theta for the anterior hippocampus (top) and posterior hippocampus (bottom). Tick marks on the top in magenta indicate time points at which normalized power for subsequent associative hits is significantly higher than subsequent associative misses using a random-effects model with a permutation procedure (FDR corrected p < 0.05), and tick marks in cyan indicate the opposite. Shading represents the standard error of the mean (SEM) across electrodes.
