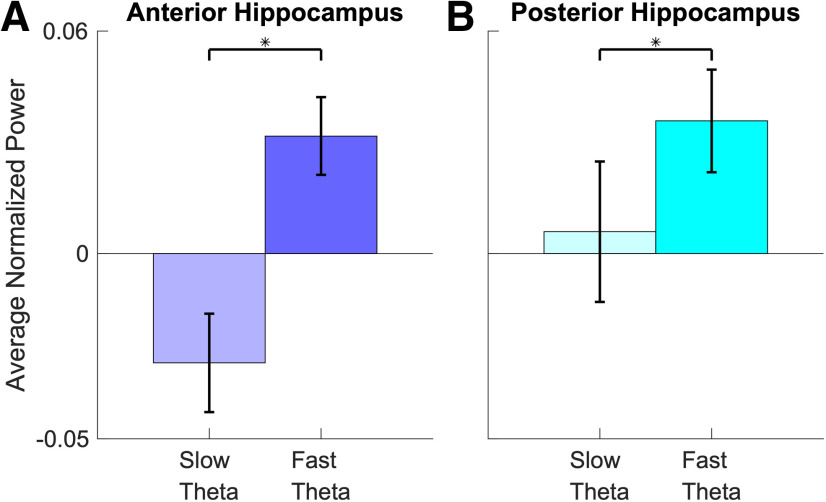
Figure 4.
A, B, Bar plots show the averaged normalized power for slow theta and fast theta across poststimulus interval (0–1600 ms) for associative misses for anterior hippocampus (A) and posterior hippocampus (B). The asterisk indicate the power for fast theta oscillations is significantly higher than that for slow theta oscillations (p < 0.05, random-effects model). Error bars indicate the SEM across electrodes.

