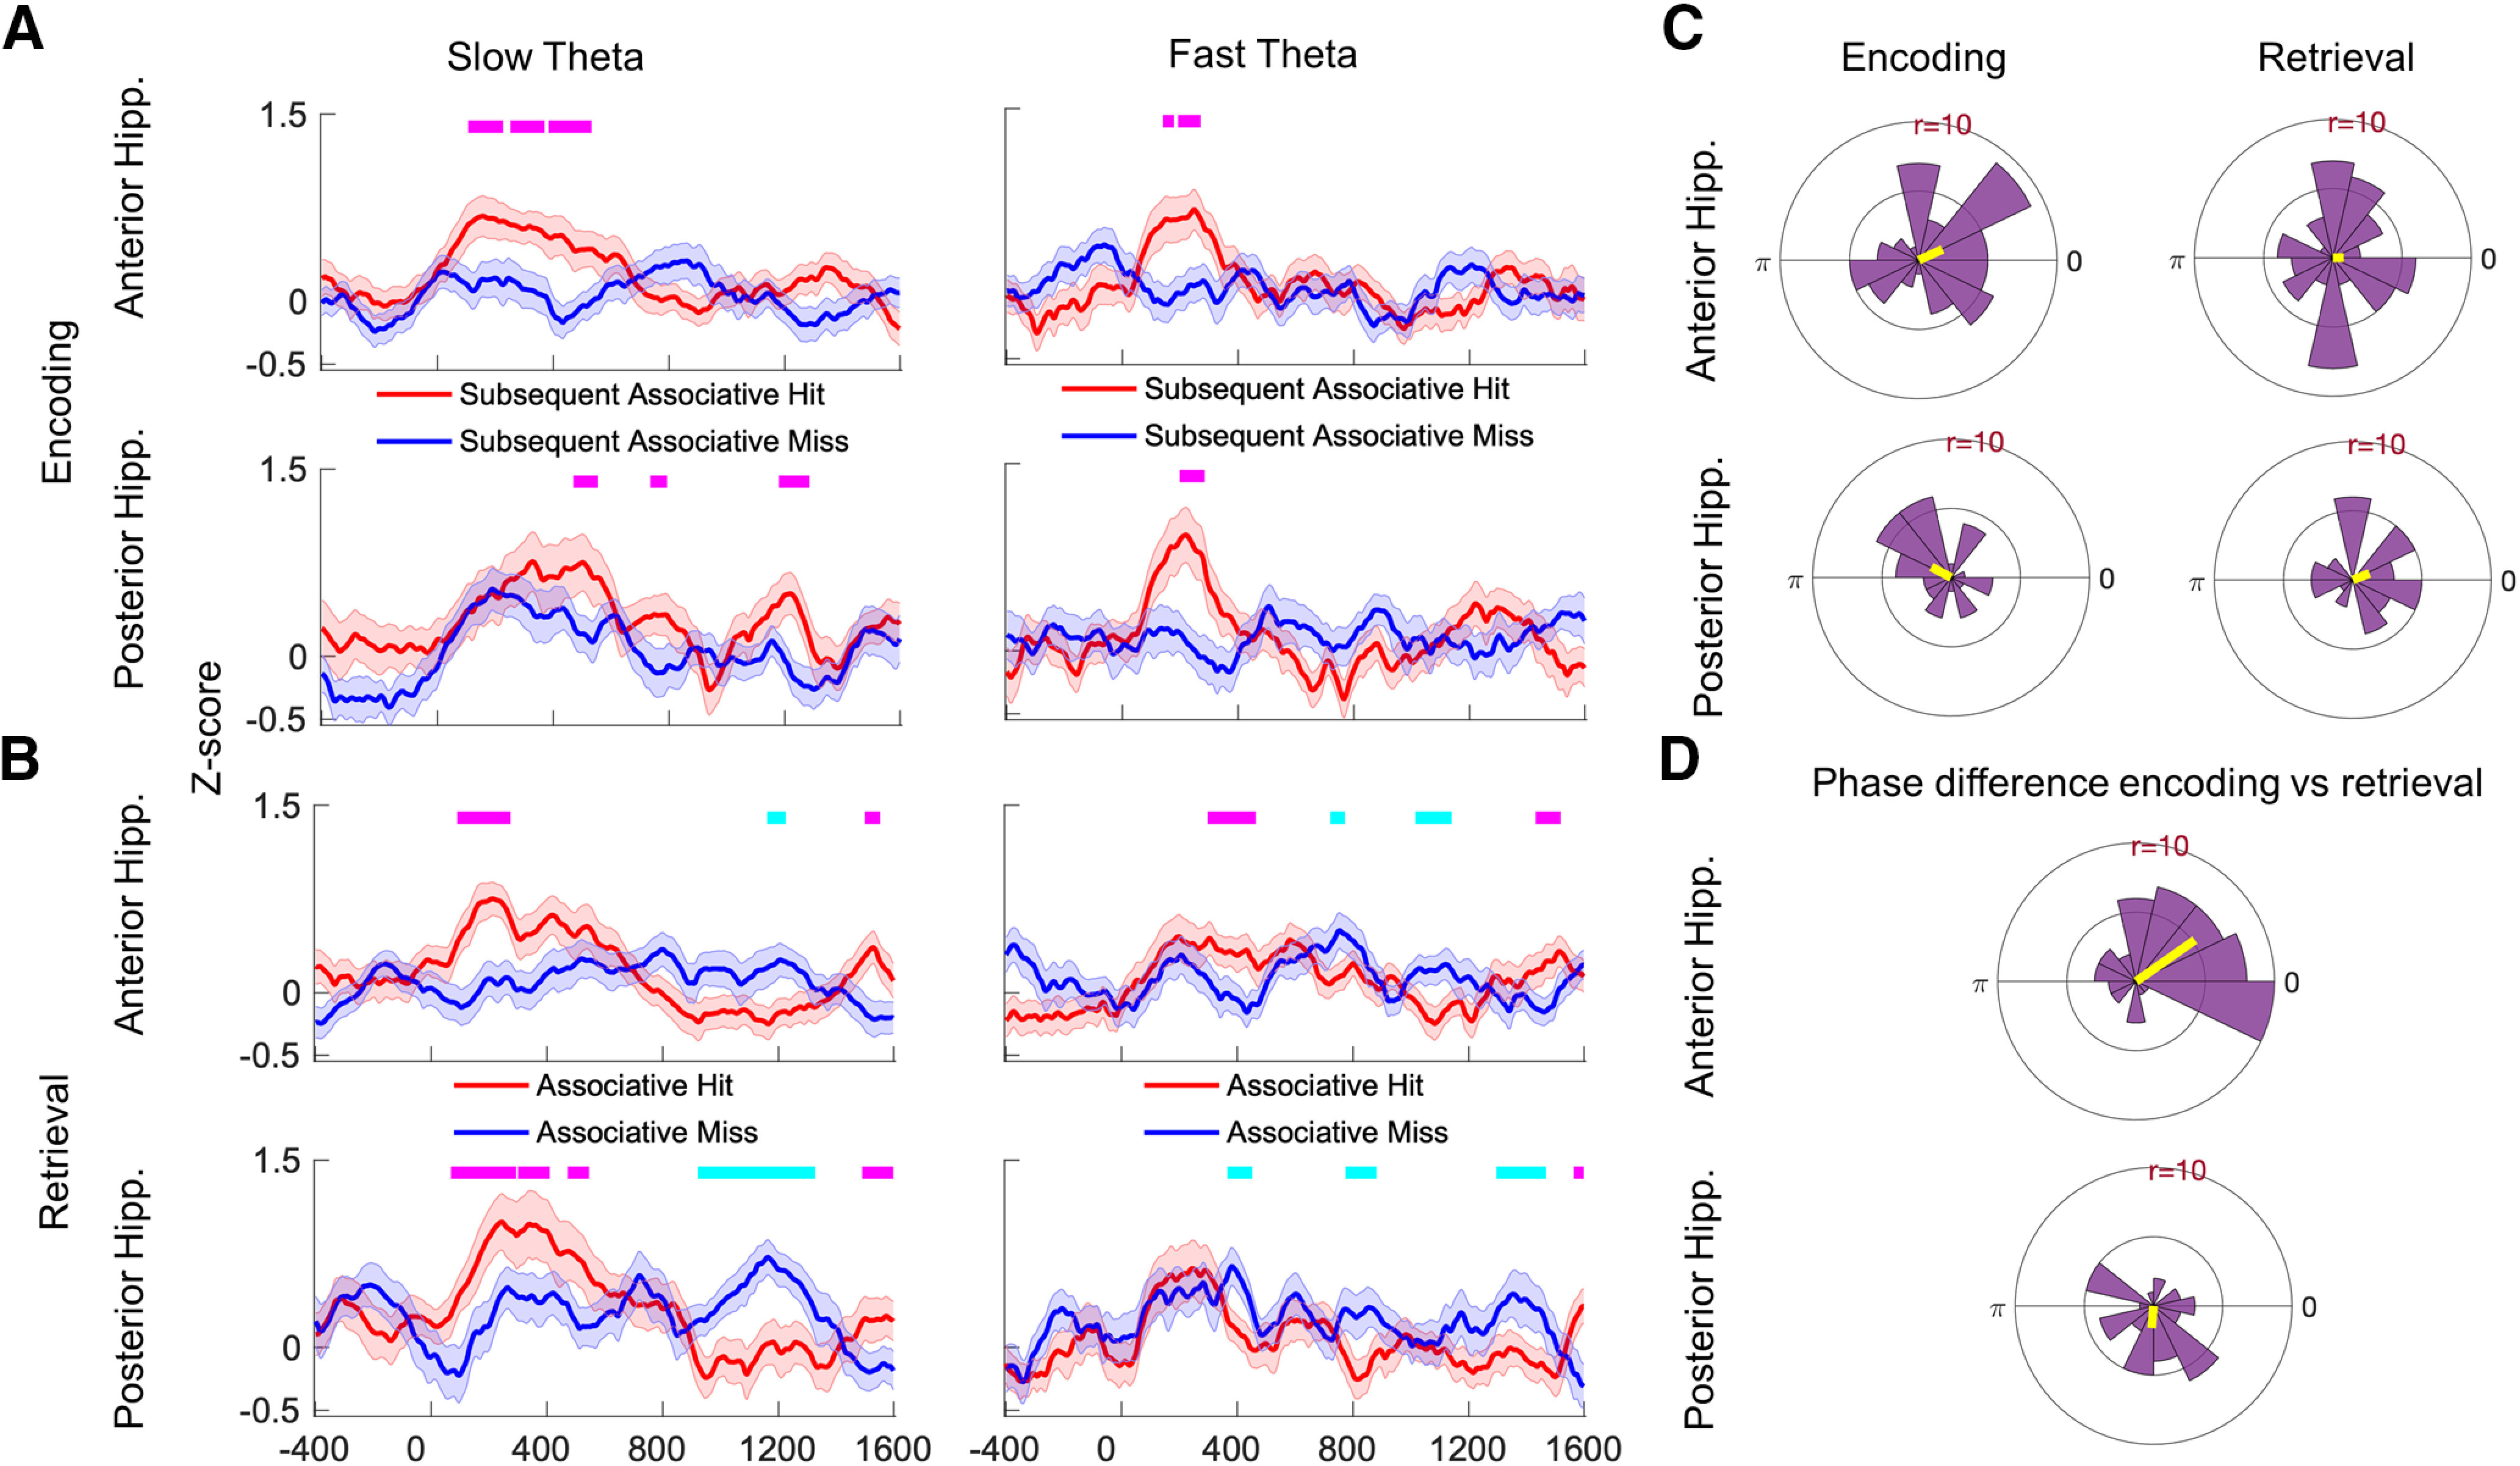
Figure 7.

Phase reset during encoding and retrieval. A, B, Average z-score values from Rayleigh test across all electrodes during encoding (A) and retrieval (B) are shown for the anterior hippocampus (top) and posterior hippocampus (bottom). Tick marks on the top in magenta indicate time points at which the z-score for associative hits is significantly higher than for associative misses using a random-effects analysis (FDR corrected p < 0.05), and tick marks in cyan indicate the opposite. C, The polar histograms show the distribution of average phase values to which reset occurred across all electrodes for slow theta in anterior hippocampus (top) and posterior hippocampus (bottom). D, Histograms of the difference in average phase values for encoding versus retrieval for slow theta oscillations. The average difference is 35° for the anterior hippocampus (top) and −95° for the posterior hippocampus (bottom).
