Figure 5.
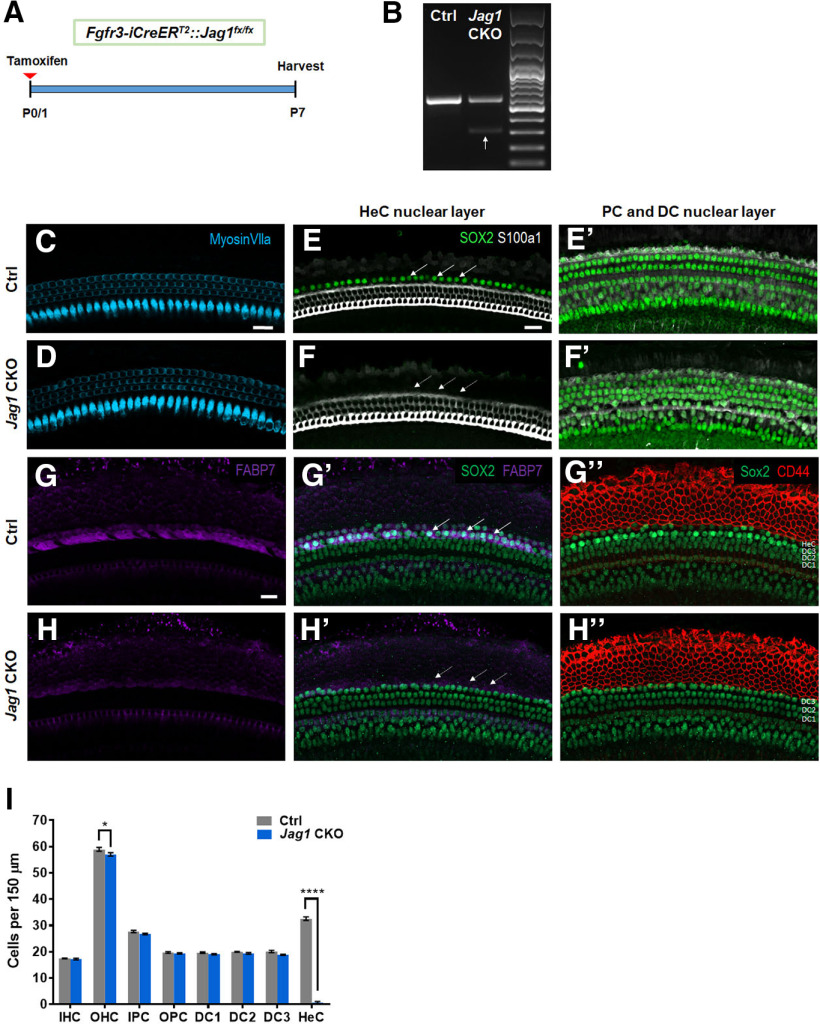
Massive loss of Hensen's cells at P7 after neonatal deletion of Jag1 from pillar and Deiters' cells. A, Experimental strategy. Fgfr3-iCreERT2::Jag1fx/fx (Jag1 CKO) and Jag1fx/fx (Ctrl) mice were injected with tamoxifen at P0/P1, and cochleae were analyzed at P7. B, RT-PCR results using RNA extracted from P7 Ctrl and Jag1 CKO whole cochlea. The upper band (541 bp) indicates the WT allele containing exon 4. The lower band (286 bp, white arrow) confirms deletion of Jag1 exon 4 in Jag1 CKO mice. The upper band is still present in Jag1 CKO mice since JAG1 is expressed in all SCs and Fgfr3-iCreERT2 only targets pillar and Deiters' cells. C, D, Representative confocal slice images of HC, labeled with myosin VIIa (blue) in P7 Ctrl (C) and Jag1 CKO (D) mice. E–F′, Representative confocal slice images of SC nuclear layers at the level of Hensen's cell nuclei (E,F) and at the level of pillar and Deiters' cell nuclei (E′,F′) showing SOX2 (an SC marker, green) and S100a1 (a pillar and Deiters' cell marker, white) expression in P7 Ctrl (E–E′) and Jag1 CKO (F–F′) mice. Arrows indicate the location of Hensen's cells (E,F). G–H′′, Representative confocal slice images of SOX2 (green), FABP7 (a Hensen's cell marker, magenta), and CD44 (a Claudius cell marker, red) expression in P7 Ctrl (G–G′′) and Jag1 CKO (H–H′′) mice. Arrows indicate the location of Hensen's cells (G′,H′). I, Quantification of IHCs, OHCs, and individual SC subtypes (inner pillar cells to Hensen's cells) in Ctrl and Jag1 CKO mice. Data are mean ± SEM; n = 4/group. *p < 0.05; ****p < 0.0001; two-way ANOVA followed by a Bonferroni post hoc test. DC1, Deiters' cell row 1; DC2, Deiters' cell row 2; DC3, Deiters' cell row 3; HeC, Hensen's cell; IPC, inner pillar cell; OPC, outer pillar cell. Scale bar, 20 μm.

