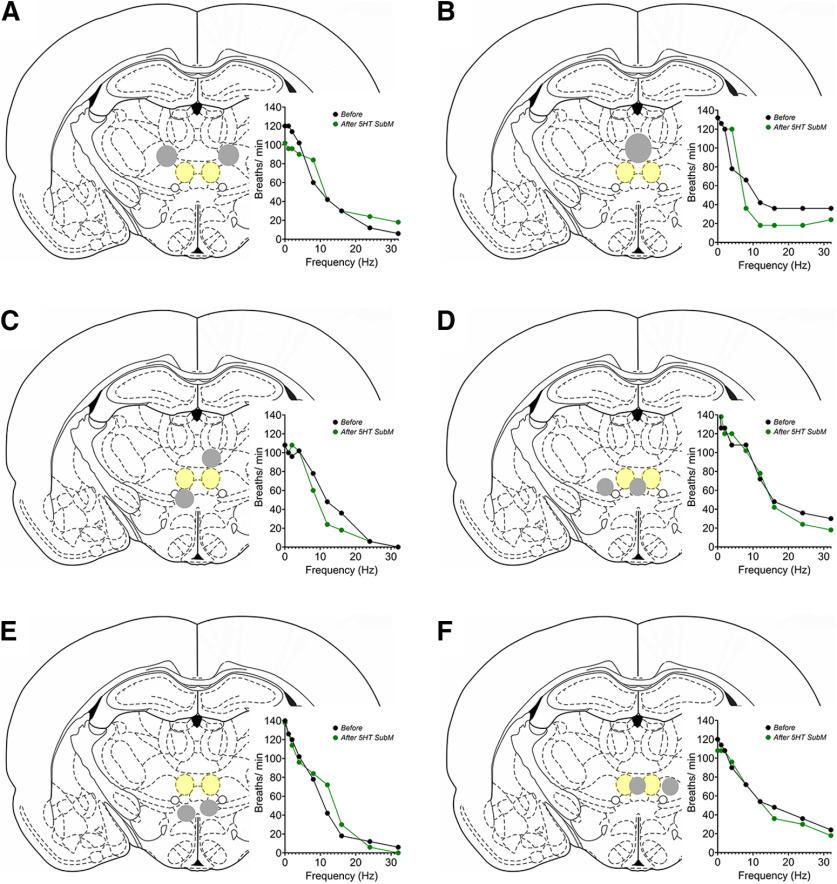
Figure 2.
Schematic representations of microinjections of 5-HT into brain regions surrounding the SubM. Each coronal schematic represents an individual rat, with the SubM highlighted in yellow shading and the “missed” injection sites highlighted in gray shading. A–F, Microinjection sites encompassed rat 1, ventrolateral and paracentral thalamic nuclei (A); rat 2, central medial thalamic nucleus (B); rat 3, central medial, paracentral, and ventral reuniens thalamic nuclei (C); rat 4, reuniens and ventromedial thalamic nuclei (D); rat 5, dorsal hypothalamic area (E); and rat 6, rhomboid and ventromedial thalamic nuclei (F). No significant effect on respiration was observed for each brain region (see graph insert for each brain image). Each coronal slice represents bregma level from −2.70 to −2.80 mm.

