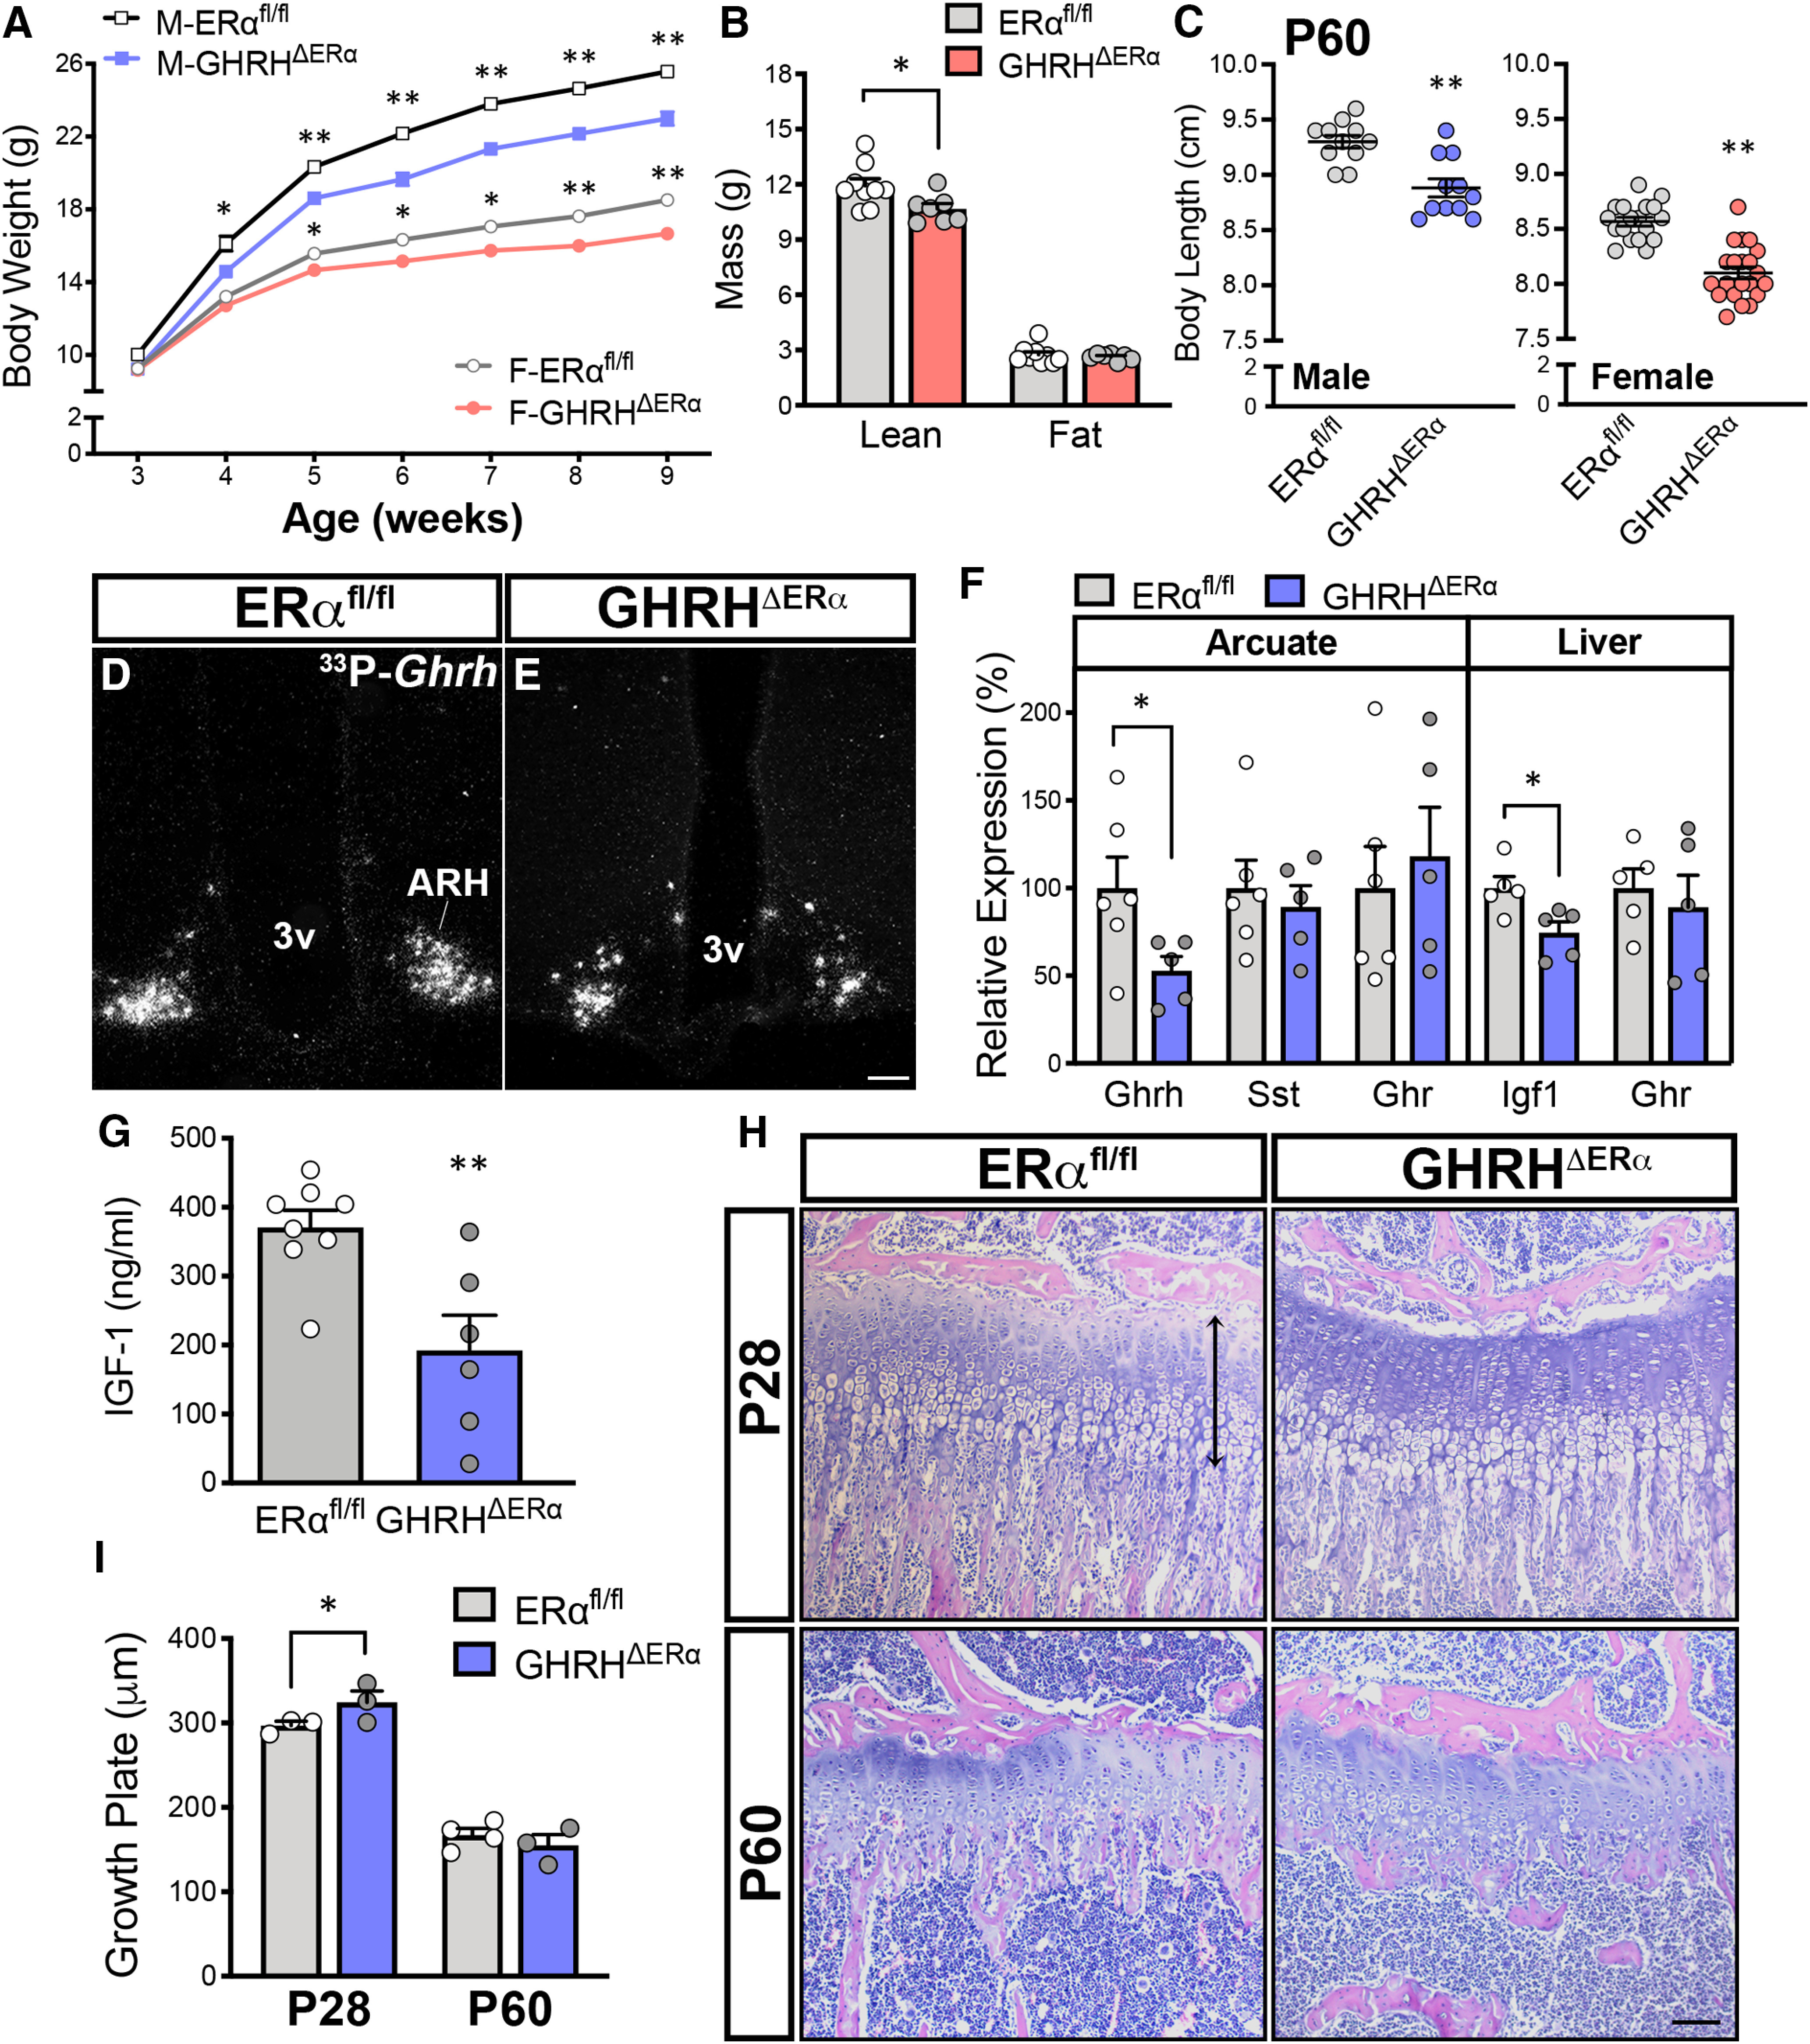
Figure 2.

Mice with deletion of ERα in GHRH cells have altered growth axis. A, Reduced body weight of GHRHΔERα males (M; n = 14/genotype) and females (F; n = 24-26/genotype) versus ERαfl/fl males (F(1,26) = 37.79, p < 0.0001) and females (F(1,48) = 30.97, p < 0.0001) by two-way repeated-measures ANOVA with Sidak's multiple comparisons. B, Altered lean mass in adult GHRHΔERα (n = 7) versus ERαfl/fl females (n = 9; t(14) = 2.75, p = 0.017). No differences in fat mass were observed. C, Reduced body length at P60 in GHRHΔERα males (n = 11) and females (n = 21) versus ERαfl/fl males (n = 11; t(20) = 4.19, p < 0.0005) and females (n = 18; t(37) = 6.78, p < 0.0001). D, E, Representative darkfield micrographs showing Ghrh mRNA (hybridization signal) in the ARH of ERαfl/fl and GHRHΔERα males. F, Relative mRNA expression levels for Ghrh, Sst, and Ghr genes in ARH punches (n = 6) and hepatic Ghr and Igf1 genes in ERαfl/fl and GHRHΔERα males (n = 5/group). G, Reduced circulating IGF-1 levels in adult GHRHΔERα (n = 6) compared with ERαfl/fl (n = 8; t(12) = 3.41, p = 0.005) males. H, Representative brightfield micrographs of the tibial growth plate at proximal metaphysis of ERαfl/fl and GHRHΔERα mice at P28 (n = 3/group) and P60 (n = 3 or 4/group) stained with H&E. I, Bar graphs represent size of the growth plate in pubertal (P28; t(12) = 2.56, p = 0.025) and adult (P60) mice. *p < 0.05; **p < 0.01; unpaired two-tailed Student's t test. 3v, Third ventricle. Scale bar, 100 µm.
