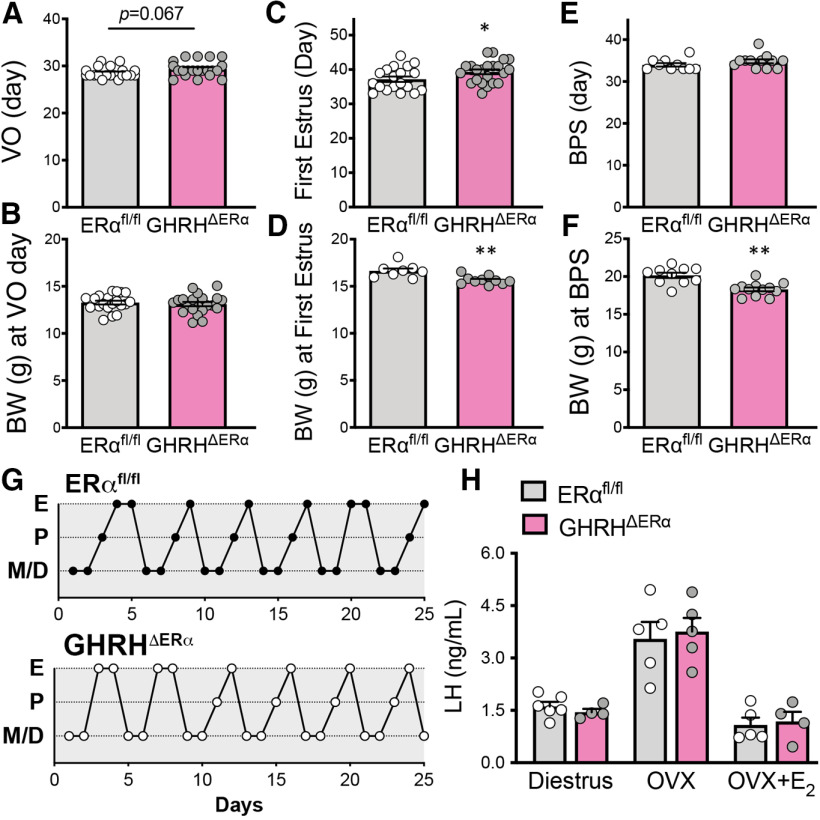
Figure 3.
Mice with deletion of ERα in GHRH cells have delayed pubertal completion. A–F, Bar graphs represent (A) day of VO (t(39) = 1.88, p = 0.067), (B) body weight at day of VO (t(36) = 0.39, p = 0.69), (C) day of first estrus (t(39) = 2.08, p = 0.044), (D) corporal weight at day of first estrus (t(16) = 3.59, p = 0.003), (E) day of BPS (t(20) = 1.29, p = 0.21), and (F) corporal weight at day of BPS (t(20) = 4.35, p = 0.0003) comparing genotypes. Females showed a delay in first estrus and decreased body weight at first estrus, and males showed a decrease in body weight at day of BPS. G, Estrous cycles of 2 representative females from each genotype. H, Bar graphs represent LH levels in diestrus (t(8) = 0.93, p = 0.38), ovariectomized (OVX; t(8) = 0.33, p = 0.75), and OVX supplemented with 17β-estradiol (E2; t(7) = 0.30, p = 0.77) mice comparing genotypes. E, Estrus; P, proestrus; M, metestrus; D, diestrus. *p < 0.05; **p < 0.01; unpaired two-tailed Student's t test.

