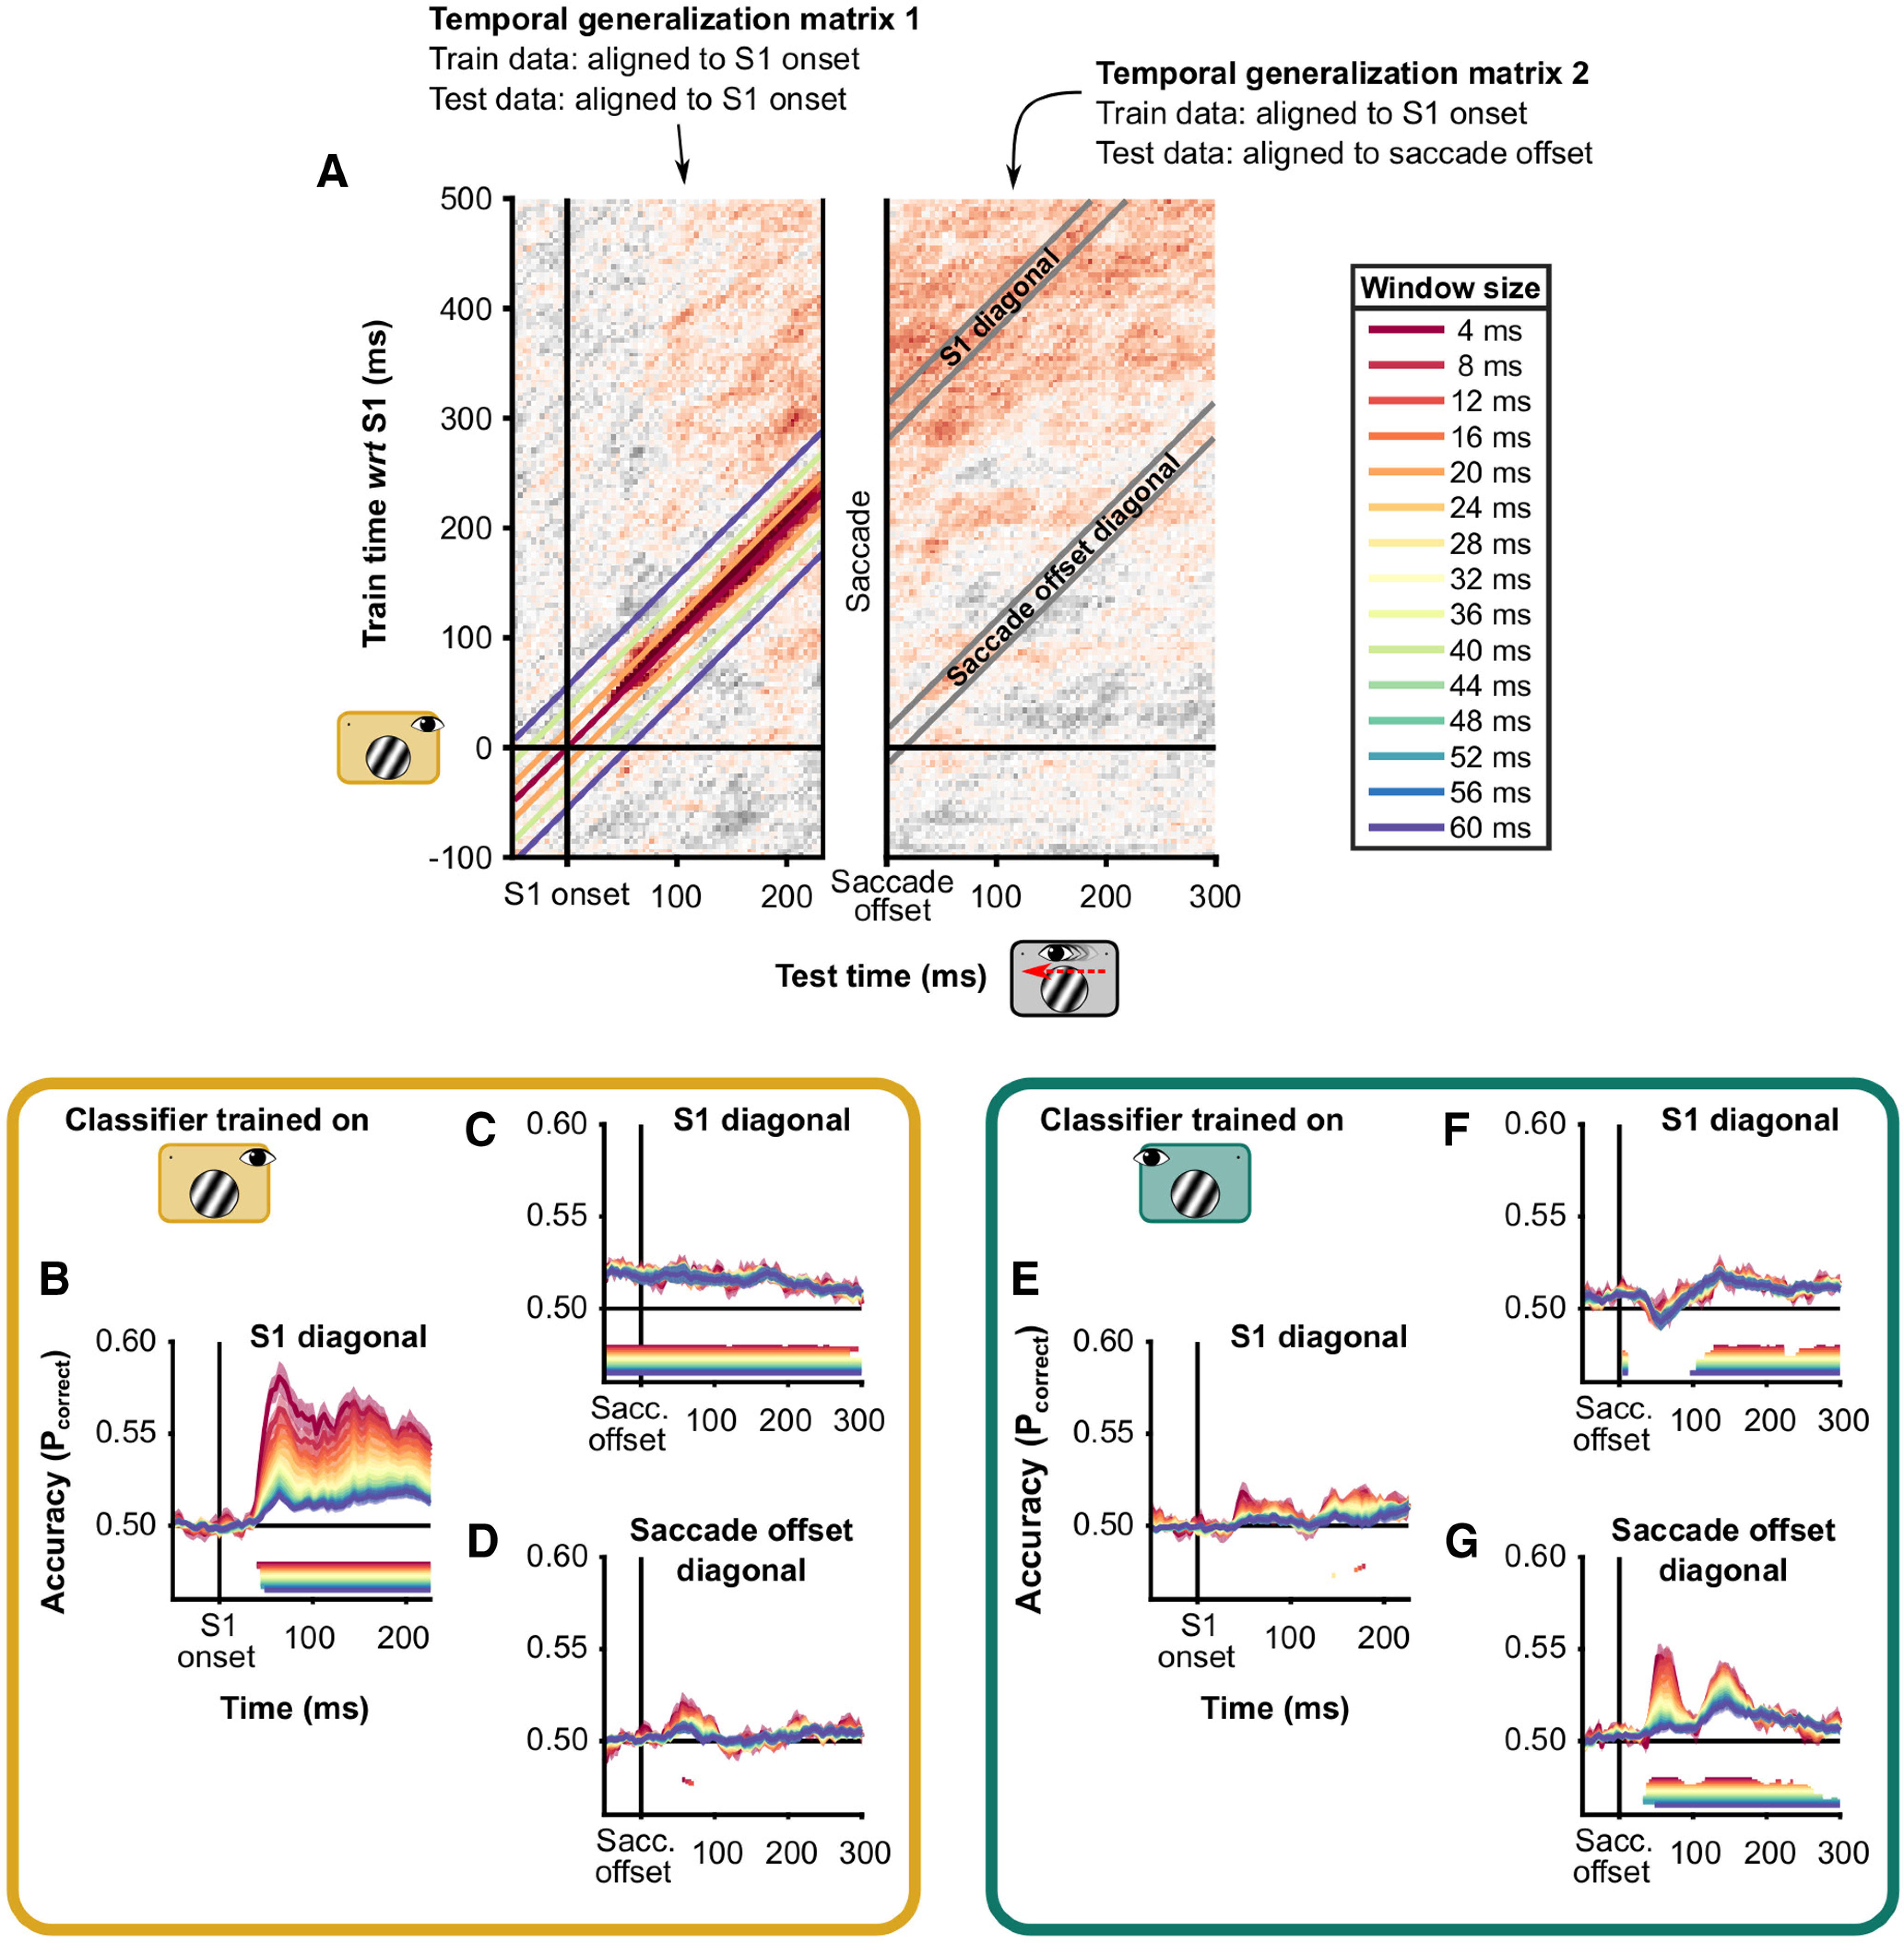
Figure 4.

Classification on diagonals of temporal generalization. A, Temporal generalization matrices as depicted in Figure 3A. The figure consists of two temporal generalization matrices, one where the test data (from the Saccade condition) are aligned to stimulus (S1) onset and one where the test data are aligned to saccade offset. In both cases, the classifiers were trained on data from the Fixation condition. On top of temporal generalization matrix 2, the diagonals are depicted in gray. These diagonals have a width of 20 ms; that is, they average cells of the matrix that are within 20 ms of the actual diagonal. At a temporal resolution of 250 Hz, this means five samples. On temporal generalization matrix 1, diagonals of four different widths are visualized. B–D, Diagonals extracted from temporal generalization matrices where the data of the Fixation, Left VF were used to train the classifiers. E–G, Like B–D, but where the data of the Fixation, Right VF were used to train the classifiers. In each panel, periods with significant above-chance classification are indicated by horizontal lines, in the same color as the data.
