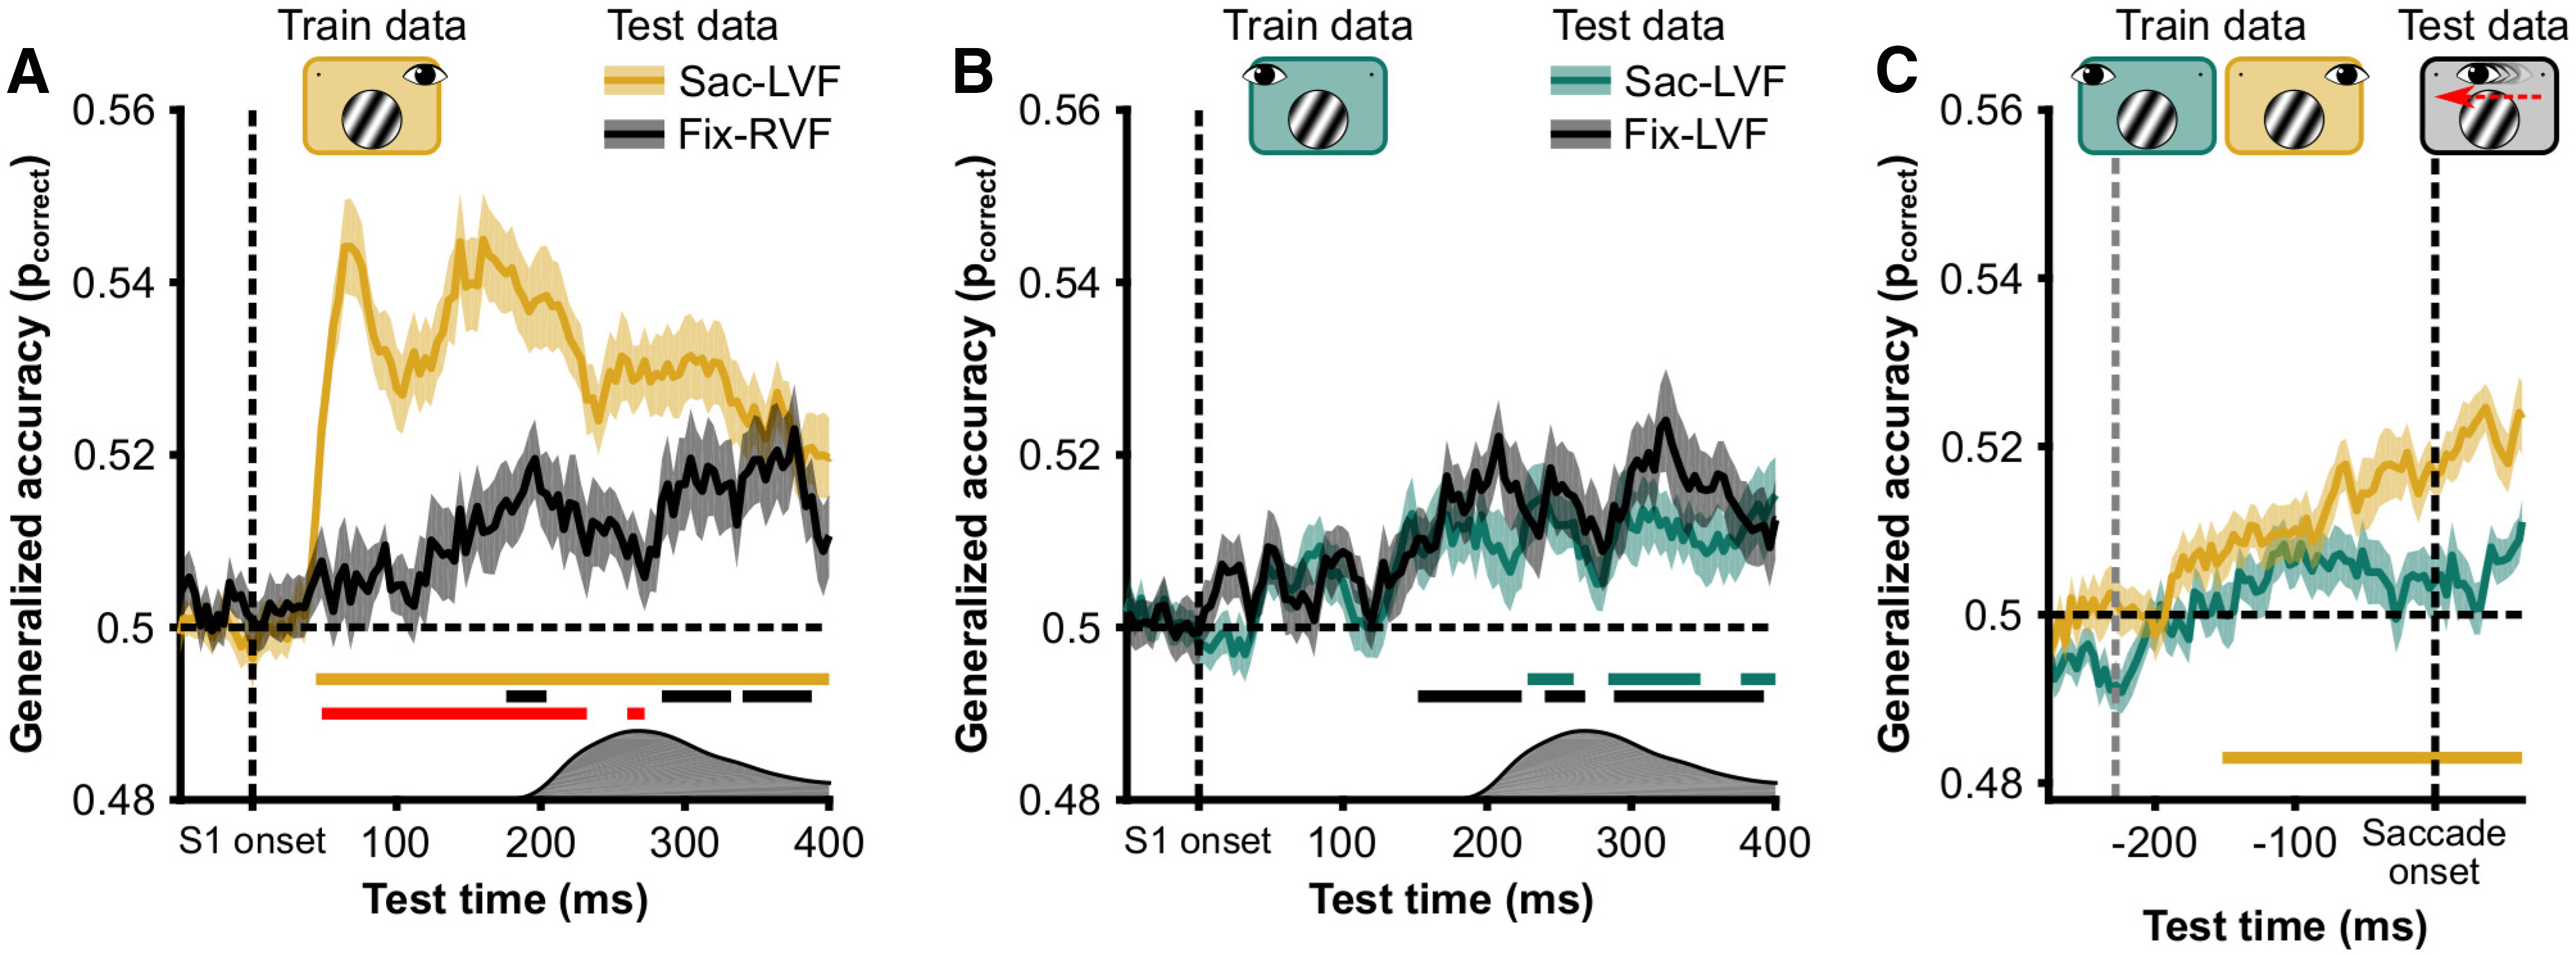
Figure 5.

Control analyses. A, Spatial invariance of spatial frequency decoding. Classifier was trained on Fix-LVF data and used to classify Fix-RVF data (green) and Sac-LVF (yellow, a replication of the brown line in Fig. 3D). Data presented here are diagonals from the temporal generalization matrix (as depicted in Fig. 3). Horizontal yellow and black lines indicate significant above-chance (pcorrect = 0.5) classification. Red line indicates a difference in classification between Fix-RVF and Sac-LVF data. Because saccades were made in the Sac-LVF condition, but not in the Fix-RVF condition, the distribution of saccade onsets is depicted on the x-axis to indicate the time at which the stimulus switched visual fields in the Sac-LVF condition. B, Like A, but for a classifier trained on the Fix-RVF data. C, Classification accuracy of a classifier trained on the Fix-LVF condition (yellow) and Fix-RVF condition (green) for classifying the Sac-LVF condition, with the Sac-LVF data aligned to saccade onset. The train data were aligned to stimulus onset. Before saccade onset, only the classifier trained on the retinotopically matched data (yellow) could classify spatial frequency in the Sac-LVF condition. Horizontal line indicates significantly above chance classification.
