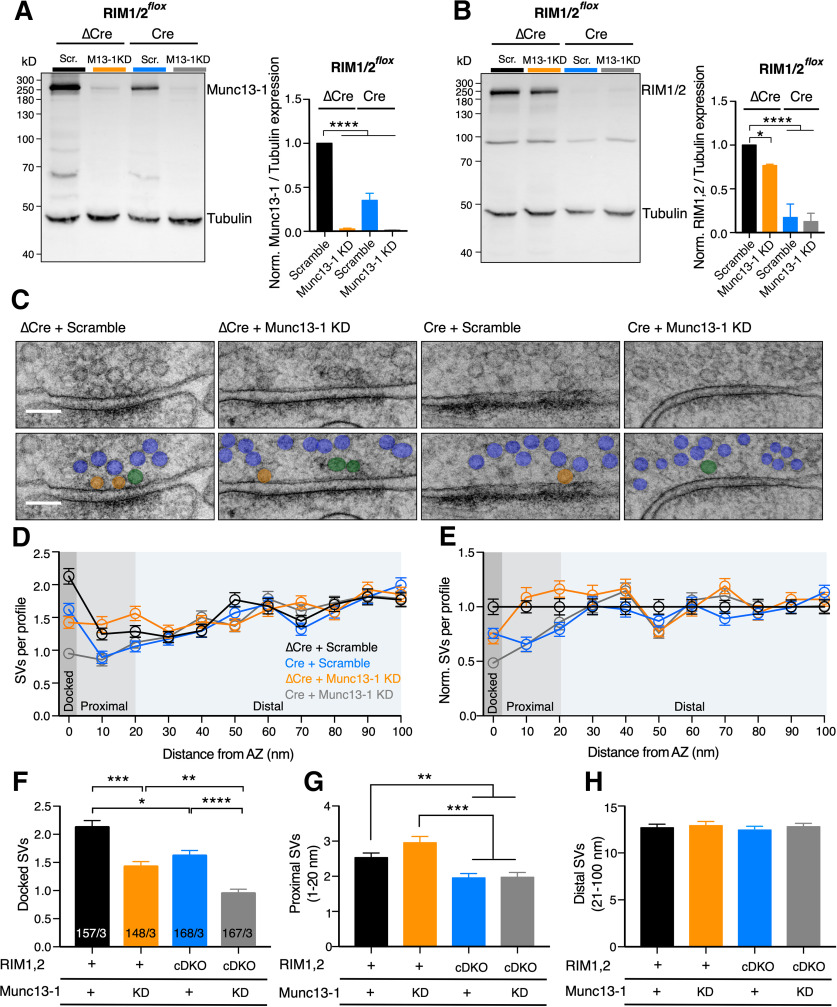
Figure 2.
Munc13-1-independent impact of RIM on SV localization. A, B, Immunoblots (left) and bar plots (right) represent the expression of Munc13-1 (A) and RIM1/2 (B) in RIM1/2flox cultures infected with ΔCre + Scramble (Scr.) shRNA (black), ΔCre + 40 × 105 infectious units (IU) Munc13-1 KD shRNA (orange), Cre + Scramble shRNA (blue), and Cre + 40 × 105 Munc13-1 shRNA (gray). Tubulin expression was used as a loading control. Molecular weight markers are indicated on blots. The analysis was performed from three independent cultures. Significance was calculated using one-way ANOVA followed by Tukey's post hoc test (A: F(3,8) = 133.8, p < 0.0001; B: F(3,8) = 48.07, p < 0.0001). C, Example TEM images of RIM1/2flox hippocampal cultures infected as in A and B. Top, Raw images. Bottom, Vesicles are color-coded according to their distance to the AZ membrane: docked SVs (orange), proximal SVs (green), distal SVs (blue). Scale bar, 100 nm. Additional example pictures are represented in Extended Data Figure 2-2. D, E, Plot represents the SV number as a function of distance from the AZ membrane (binned 10 nm; D) and the same values normalized to the control (binned to 10 nm; E). F–H, Bar plots displaying the mean number of docked SVs (F), proximal SVs (1-20 nm) (G), and distal SVs (21-100 nm) (H). Bar graph label “+” indicates endogenous expression of RIM1/2 or Munc13-1. “KD” refers to Munc13-1 KD. “cDKO” refers to RIM1/2-deficient neurons. Number of synaptic profiles for D–H are indicated in F. Values indicate mean ± SEM. *p ≤ 0.05; **p ≤ 0.01; ***p ≤ 0.001; ****p ≤ 0.0001; nonparametric one-way ANOVA with Kruskal–Wallis test followed by Dunn's post hoc test. For the statistical overview, see also the table in Extended Data Figure 2-1.

