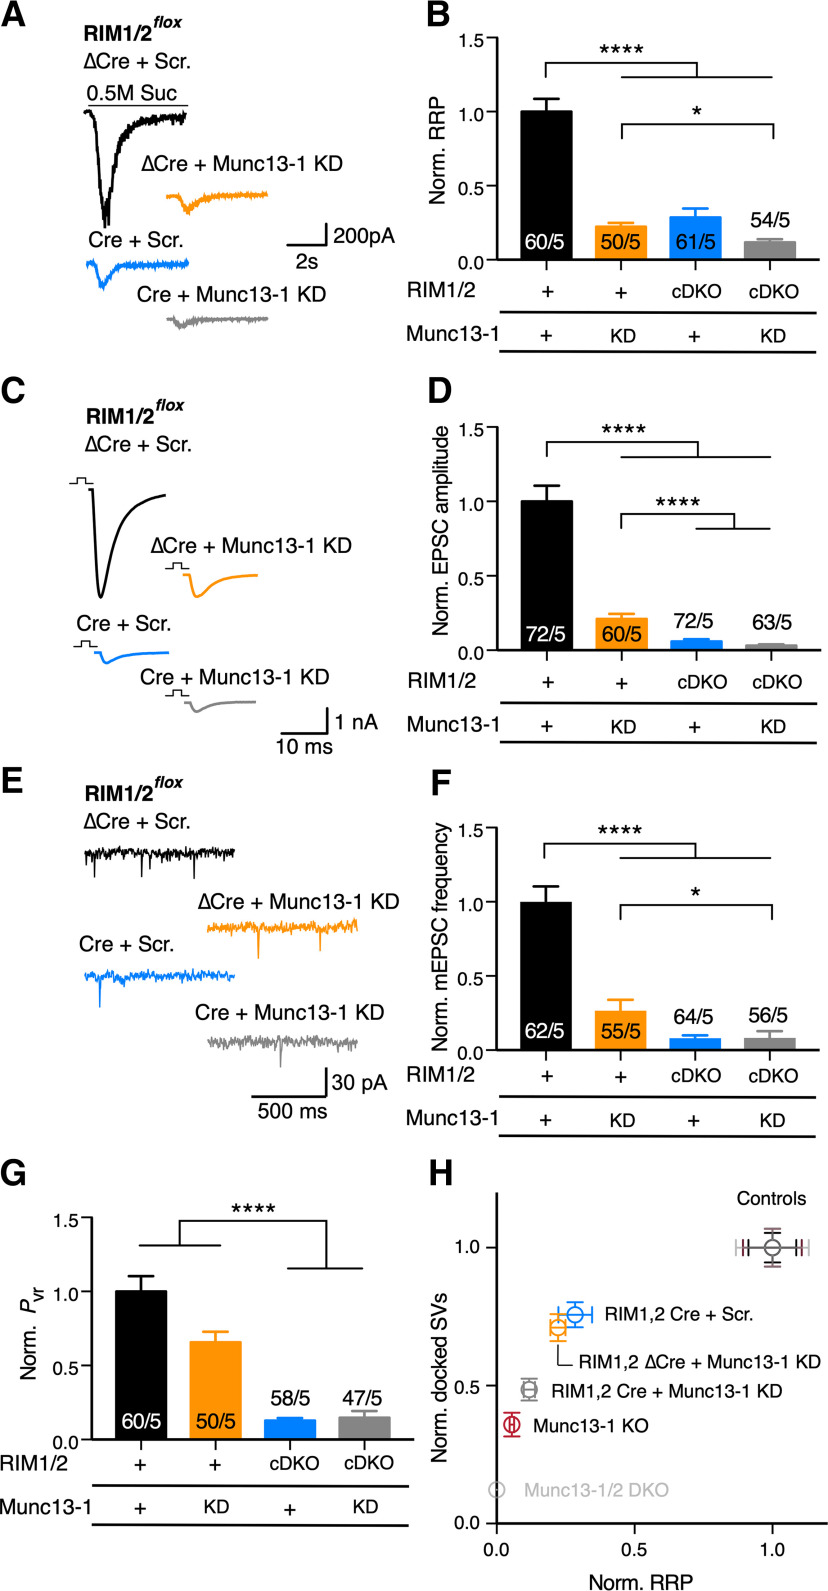
Figure 6.
RIM-independent function of Munc13-1 on synaptic properties. A, Sample traces represent the current evoked by hypertonic sucrose as an estimate for RRP in RIM1/2flox cultures infected with ΔCre + Scramble (Scr.) shRNA (black), ΔCre + 40 × 105 IU of Munc13-1 KD shRNA (orange), Cre + Scramble shRNA (blue), and Cre + 40 × 105 Munc13-1 shRNA (gray). B, Bar plot represents the normalized mean of charge released by hypertonic sucrose (referred to as RRP). C, D, Sample traces of EPSC (C) and bar plot of normalized EPSC amplitude. E, F, Sample traces of spontaneous release events (E), and the bar plot represents the normalized mean mEPSC frequency (F). G, Bar plot represents the normalized Pvr. Normalization in all of the bar plots is performed relative to the corresponding control (ΔCre + scramble; black). In graph labels, “+” refers to the endogenous expression. “KD” refers to the Munc13-1 KD. “cDKO” refers to RIM1/2 deficiency. Numbers in bars indicate the cell number/culture number. Data indicate normalized mean ± SEM. *p ≤ 0.05; ****p ≤ 0.0001; nonparametric one-way ANOVA with Kruskal–Wallis test followed by Dunn's post hoc test. For the absolute values and statistical overview, see also the table in Extended Data Figure 6-1. H, Plot represents the SV docking/priming relationship. Munc13-1/2 DKO data are adapted from Camacho et al. (2017). Controls represent ΔCre + Scr., Munc13-1 WT, and Munc13-1/2 DKO rescue with WT Munc13-1 (Camacho et al., 2017).

