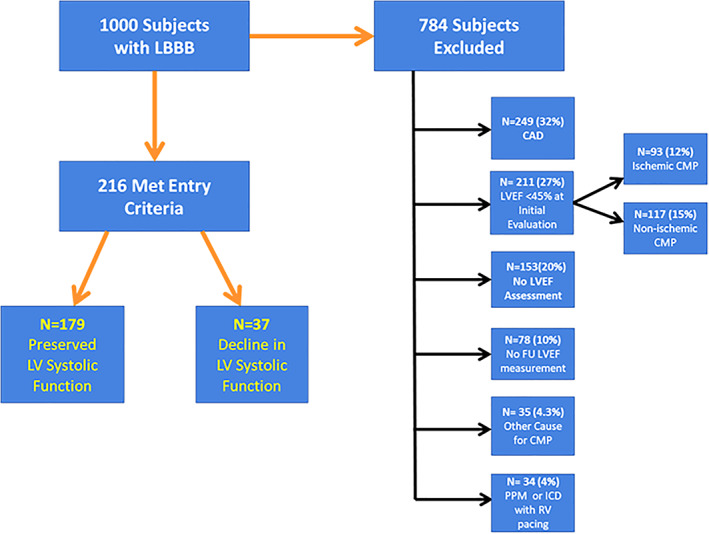
FIGURE 1.

Study population‐reasons for exclusion. Flow chart depicting the subjects screened for this analysis with excluded patients and reason for exclusion shown on the right. 24 patients were excluded (not shown) because the LBBB was found to be intermittent (n = 22) or the ECG did not meet criteria for LBBB (n = 2)
