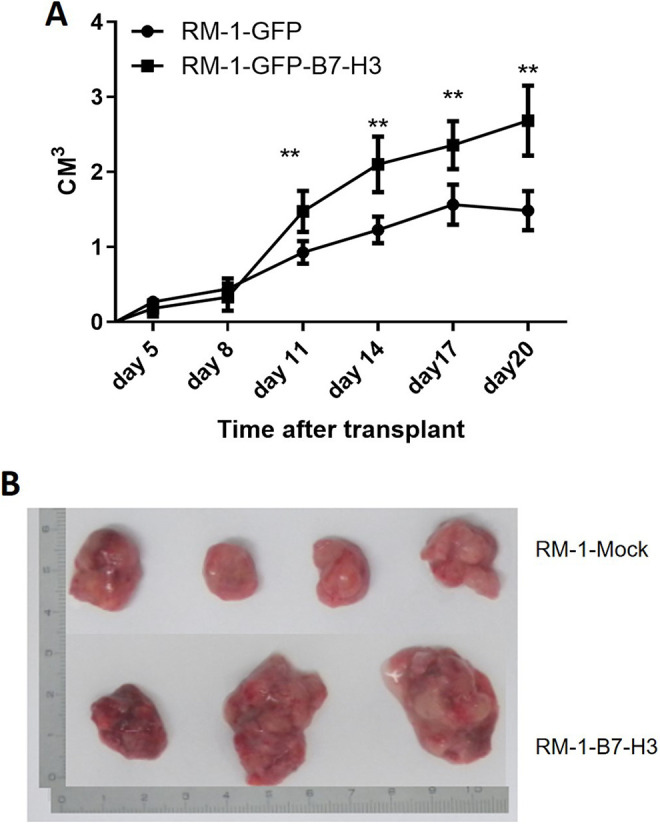
Figure 2.

Effect of B7-H3 on prostate cancer cell tumorigenesis in vivo. A. Transplanted tumor growth curves. The top curve shows the changes in xenograft tumor volumes in the groins of the B7-H3 overexpression group, and the lower curve shows the changes in the tumor volumes in the B7-H3 underexpression group. B. Tumor morphology in the experimental and control group. The 4 tumor specimens shown at the top are from the control group, and the 3 specimens shown at the bottom are from the experimental group.
