Figure 2.
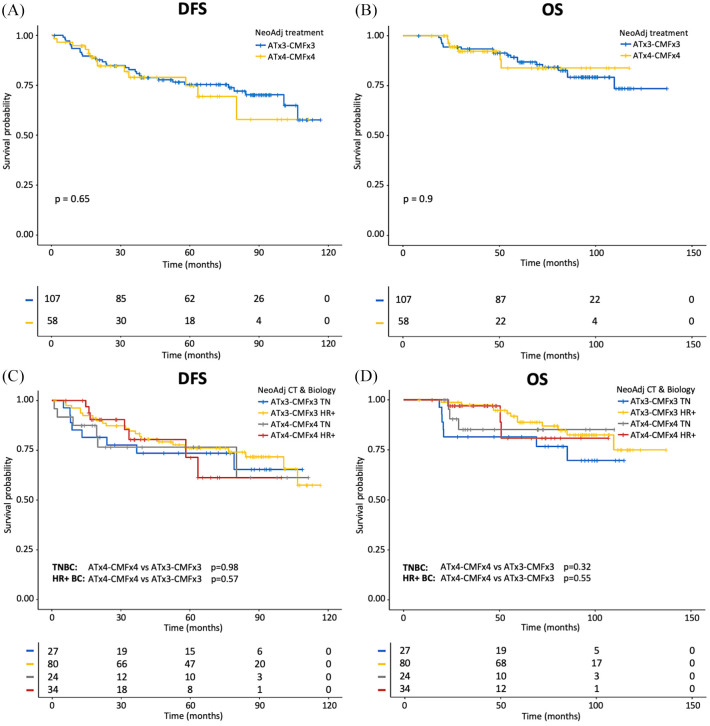
Kaplan–Meier curves for DFS and OS according to duration of neoadjuvant ChT after excluding cT4 stage patients.
A, C: Kaplan–Meier curves of DFS according to duration of treatment (A); Kaplan–Meier curves of DFS according to duration of treatment and tumor biology (TN and HR+ BC) (C). B, D: Kaplan–Meier curves of OS according to duration of treatment (B); Kaplan–Meier curves of OS according to duration of treatment and tumor biology (TN and HR+ BC) (D). The + symbol indicates patients censored at the time of data cut-off and analysis.
BC, breast cancer; ChT, anthracycline-taxane-based chemotherapy; DFS, disease-free survival; HR+, hormone receptor-positive; OS, overall survival; TN, triple-negative.

