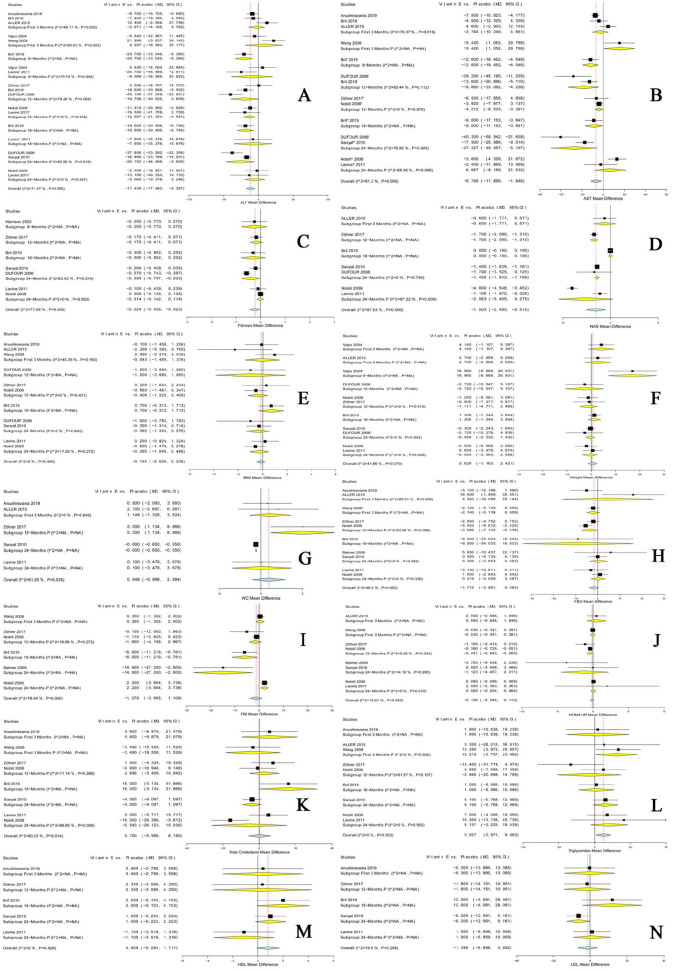
Figure 3.
Forest plots show the MD in each outcome along with the associated 95% CI in the two arms at 3, 6, 12, 18, and 24 months; p indicates pediatric population. Outcomes: (A) ALT, (B) AST, (C) fibrosis, (D) NAS, (E) BMI, (F) weight, (G) waist-circumference, (H) FBG, (I) FBI, (J) HOMA-IR, (K) total-cholesterol, (L) triglycerides, (M) to HDL, (N) LDL.
ALT, alanine aminotransferase; AST, aspartate aminotransferase; BMI, body mass index; CI, confidence interval; FBG, fasting blood glucose; FBI, fasting blood insulin; HDL, high-density lipoprotein; HOMA-IR, homeostatic model assessment of insulin resistance; LDL, low-density lipoprotein; NAFLD, non-alcoholic fatty liver disease; NAS, NAFLD activity score.

