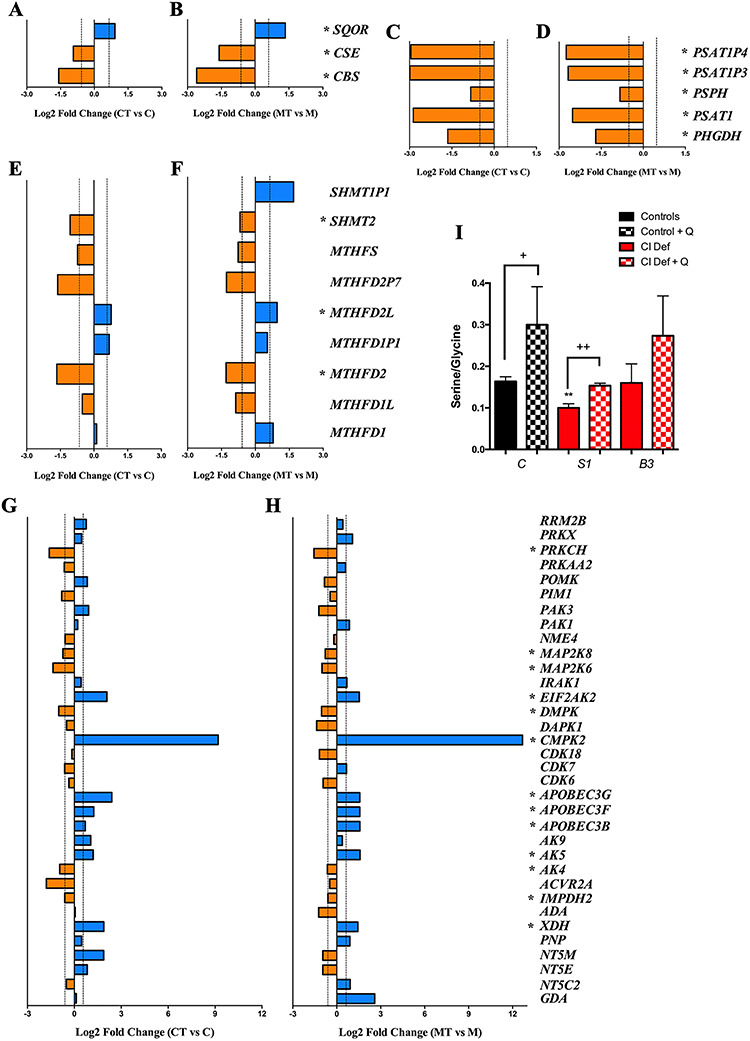
Figure 2.

Changes in gene expression of pathways related to sulfide metabolism in response to CoQ10 supplementation. (A and B) Changes in the expression of genes related to cysteine biosynthesis and sulfide metabolism in control (A) and mutant (B) cells after CoQ10 supplementation. (C and D) Changes in the expression of genes related to serine/glycine biosynthesis in control (C) and mutant (D) cells after CoQ10 supplementation. (E and F) Changes in the expression of genes related to the folate cycle in control (E) and mutant (F) cells after CoQ10 supplementation. (G and H) Changes in the expression of genes related to nucleotides metabolism in control (G) and mutant (H) cells after CoQ10 supplementation. Bars in blue indicate genes overexpressed; bars in orange indicates genes underexpressed. Dotted lines indicate the threshold considered for overexpression (log2 FC = 0.585) or underexpression (log2 FC = −0.585). Asterisks indicates the genes that exceed the fold change threshold and have P-values less than 0.05 in the comparison of treated and untreated cells in both control and mutant cells. C, control; CT, control treated with CoQ10; M, NDUFS1 mutant; MT, NDUFS1 mutant treated with CoQ10. (I) Serine/Glycine ratio in control (black bars) and patients’ cells (red bars) with mutations in NDUFS1 and NDUFB3, and their response to CoQ10 supplementation (checkered bars). Data are expressed as mean ± SD. **P < 0.01; differences versus control. +P < 0.05; ++P < 0.01; control versus control + CoQ10 or Complex I deficiency versus Complex I deficiency + CoQ10 (t-test; n = 3 for each group; n = 3 for each group).
