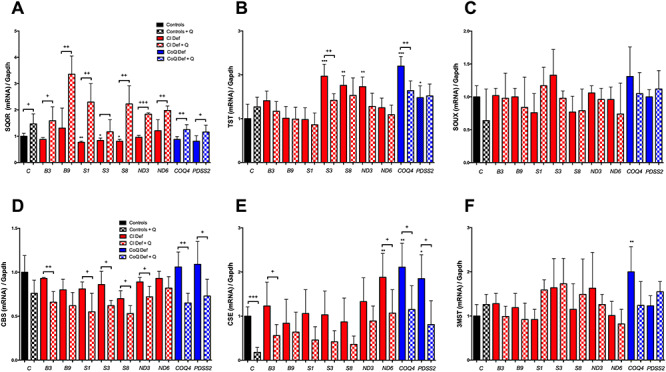
Figure 3.

CoQ10 supplementation modifies the expression of key genes in the mitochondrial hydrogen sulfide oxidation pathway and the transsulfuration pathway. (A–C) Expression levels of genes involved in the mitochondrial hydrogen sulfide oxidation pathway. (D–F) Expression levels of genes involved in the transsulfuration pathway. Black bars indicate control cells; red bars indicate cells with mutation in Complex I genes; blue bars indicate cells with mutations in CoQ10 biosynthetic genes. Solid bars indicate untreated cells; checkered bars indicate CoQ10-treated cells. Data are expressed as mean ± SD. *P < 0.05; **P < 0.01; ***P < 0.001; differences versus Control. +P < 0.05; ++P < 0.01; +++P < 0.001; control versus control + CoQ10 or Complex I deficiency versus Complex I deficiency + CoQ10 or CoQ10 deficiency versus CoQ10 deficiency + CoQ10 (t-test; n = 3 for each group; n = 3 for each group). C, control; B3, NDUFB3 mutant; B9, NDUFB9 mutant; S1, NDUFS1 mutant; S3, NDUFS3 mutant; S8, NDUFS8 mutant; ND3, ND3 mutant; ND6, ND6 mutant; COQ4, COQ4 mutant; PDSS2, PDSS2 mutant; CI Def, cells with Complex I deficiency; CoQ Def, cells with CoQ10 deficiency; Q, CoQ10.
