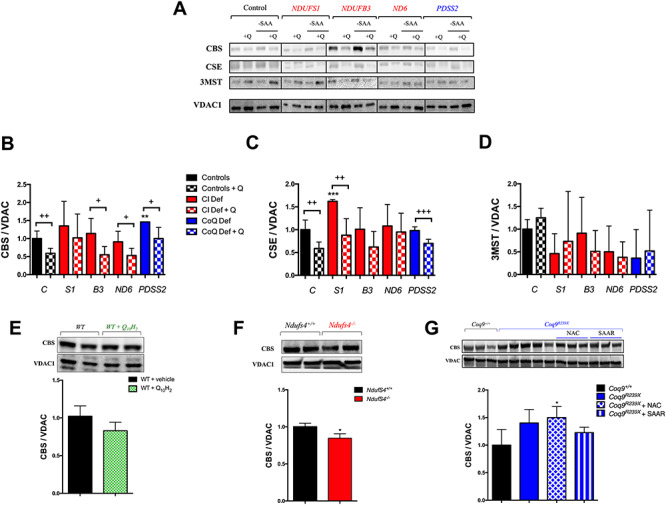
Figure 5.

CoQ10 regulates the enzymes of transsulfuration pathway independently of sulfur amino acids availability. (A–D) Levels of the proteins of the transsulfuration pathway in human skin fibroblasts from control and patients with mutations in Complex I subunits or CoQ10 biosynthetic genes. Data are expressed as mean ± SD. *P < 0.05; **P < 0.01; ***P < 0.001; differences versus Control. +P < 0.05; ++P < 0.01; +++P < 0.001; Control versus Control + CoQ10 or Complex I deficiency versus Complex I deficiency + CoQ10 or CoQ10 deficiency versus CoQ10 deficiency + CoQ10 (t-test; n = 3 for each group; n = 3 for each group). C, control; S1, NDUFS1 mutant; B3, NDUFB3 mutant; S3, NDUFS3 mutant; ND6, ND6 mutant; PDSS2, PDSS2 mutant; CI Def, cells with Complex I deficiency; CoQ Def, cells with CoQ10 deficiency; Q, CoQ10; -SAA, medium without sulfur aminoacids. The blot image (A) has been made from three different membranes, as follow: blot 1, control and PDSS2; blot 2, NDUFS1 and ND6; blot 3, NDUFB3. (E) Levels of CBS in the liver of C57bl6j mice supplemented with ubiquinol-10 for 1 month. Data are expressed as mean ± SD. *P < 0.05; **P < 0.01; ***P < 0.001; WT versus WT + CoQ10H2 (t-test; n = 4 for each group). (F) Levels of CBS in the brain of Ndufs4−/− mice. Data are expressed as mean ± SD. *P < 0.05; **P < 0.01; ***P < 0.001; Ndufs4+/+ versus Ndufs4−/− (t-test; n = 5 for each group). (G) Levels of SQOR in the kidneys of Coq9R239X with vehicle, NAC or under SAAR. Data are expressed as mean ± SD. *P < 0.05; **P < 0.01; ***P < 0.001; differences versus Coq9+/+ (t-test; n = 3 for each group; n = 3–5 for each group).
