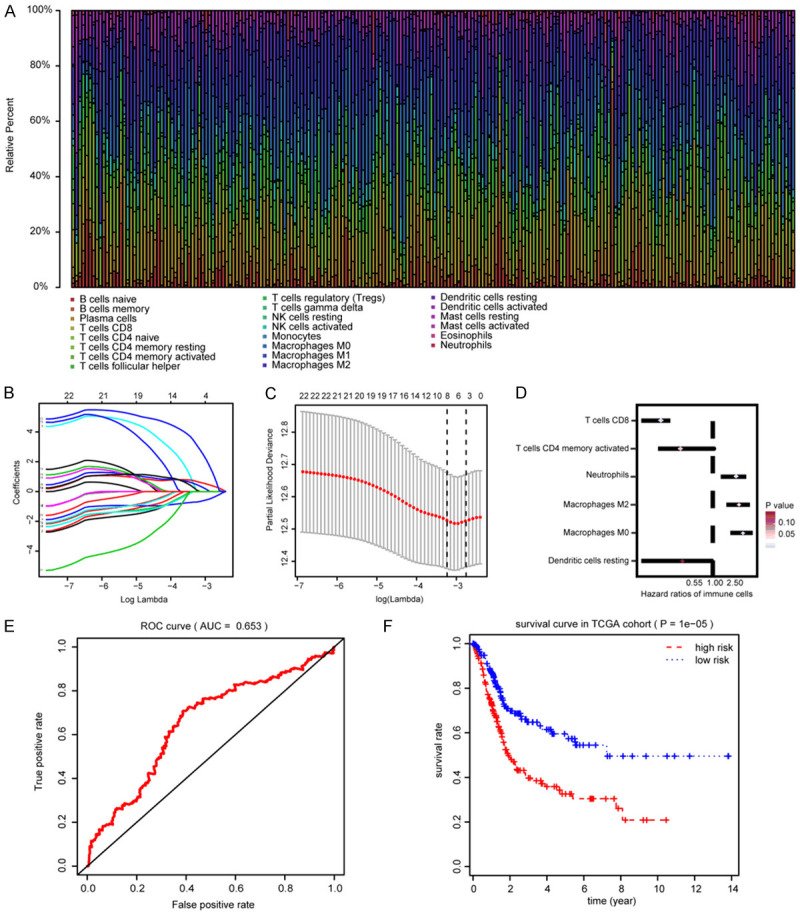
Figure 1.

Identification of hub prognostic immune infiltrating cells and construction of TIICS model. A. Summary of 22 inferred immune cell subtypes by CIBERSORT algorithm. Bar charts exhibit the cell proportions and various annotated colors represent 22 immune cells. B. Cross-validation was performed for tuning parameter selection in the LASSO regression model. C. Illustration for LASSO coefficient profiles of 22 immune cells. LASSO, least absolute shrinkage and selection operator. D. Hazard ratios of 6 prognostic immune cells associated with OS by univariate Cox analysis. E. ROC curve of TIICS model for assessment of predictive accuracy. F. Comparisons of differential survival outcomes between two TIICS levels via Kaplan-Meier analysis with log-rank test.
