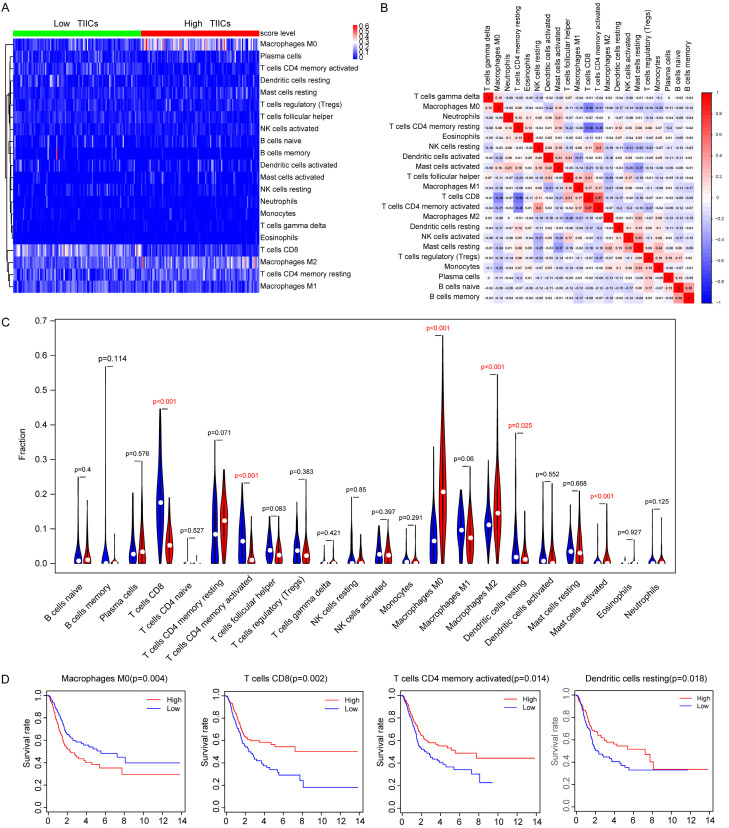
Figure 2.
Depiction and distributions of immune cells in two TIICs groups. A. Differential abundance of immune cells in two TIICS groups in heatmap plot. B. Correlation heatmap represents the coincident and exclusive associations across 22 immune cells, where blue represents the mutual exclusion and red represents the consistence ranging from -1 to 1. C. Differential density of immune cells in two TIICS groups was compared by Wilcox rank-sum test. D. Survival analysis of immune cells was conducted, where higher level of M0 macrophage correlated with poor outcomes and lower level of CD8+ T cell, memory activated CD4+ T cells, resting Dendritic cells were associated with worse prognosis.

