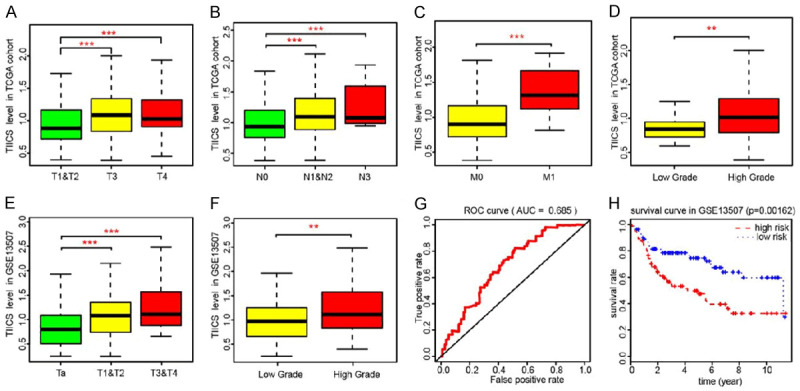
Figure 3.

Correlation analysis of TIICS with clinical characteristics and validation in an independent dataset. A-D. Non-parametric test indicated that higher TIICS level correlated with higher AJCC-TNM stages and advanced tumor grades in TCGA cohorts. E, F. Similar results were also observed in GSE13507, where higher TIICS levels also correlated with higher T stages and tumor grades. The * represented the P<0.05. The ** represented the P<0.01, and *** represented the P<0.001. G, H. TIICS model was validated in GSE13507, of which the AUC was 0.685 and the patients with higher TIICS model showed less survival time (P=0.00162).
