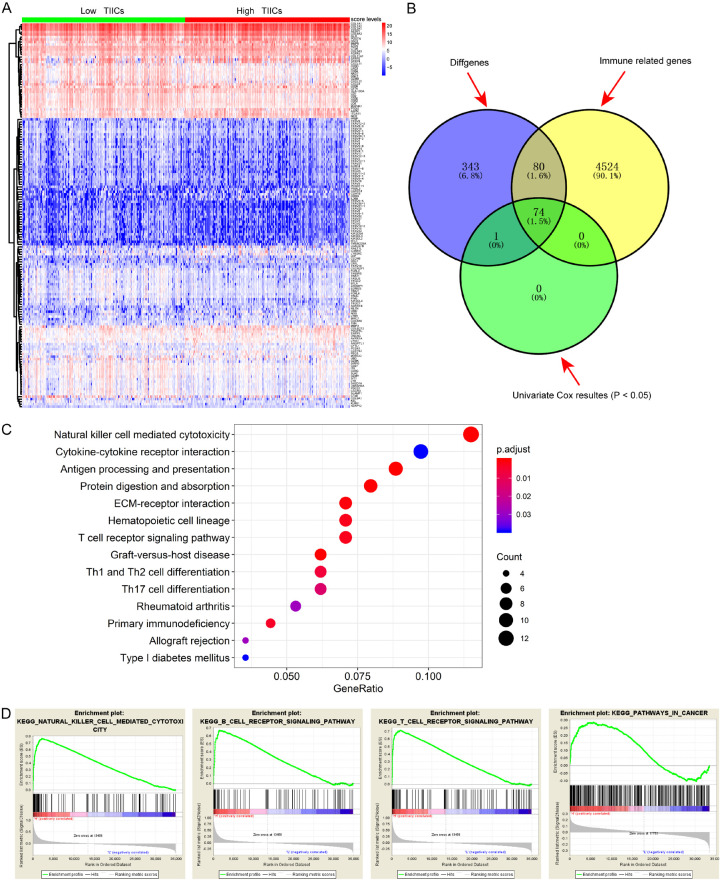
Figure 4.
Identification of hub TIICS-related immune signature and functional analysis. A. Differentially expressed genes (DEGs) between two TIICS groups with |log (Fold Change)| >1 and false discovery rate (FDR) <0.05 as the cutoff value. B. Identification of hub immune signature via intersection and Cox analysis. C. Top immune-related crosstalk that these DEGs might be involved in. D. GSEA for comparing immune phenotype between high- and low-TIICS groups.

