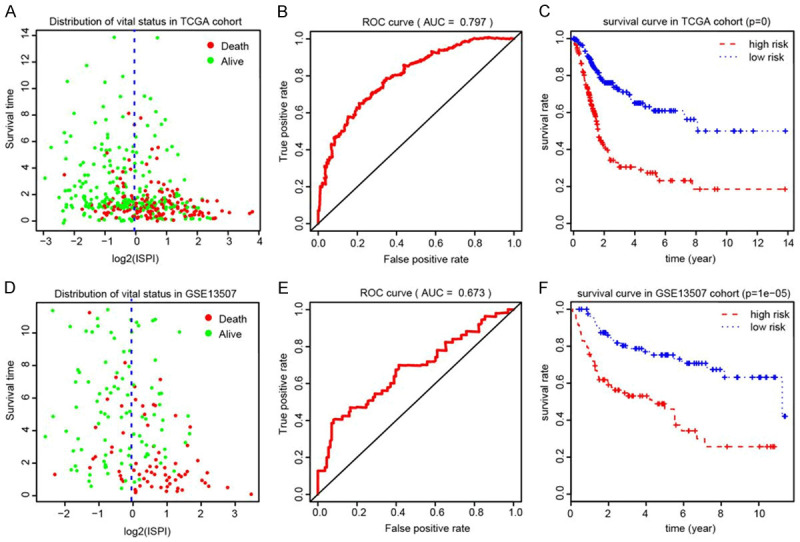
Figure 7.

Construction and evaluation of ISPI based on 16 hub signature for BLCA. A. The distribution of vital status of patients in two ISPI groups. B. The AUC of ROC curve was 0.797 showing superior predictive accuracy. C. Patients with higher level of ISPI demonstrated poor outcomes (P<0.001). D-F. Validation of the robust ISPI model in GSE13507.
